The other day I was asked, "Given a set of points, what is the area under the curve defined by those points?"
As stated, the problem is not well defined. The problem is that "the curve defined by those points" doesn't have a precise meaning. However, after gathering more information, I was able to refine the question and answer it.
The Area under a Curve as an Integration Problem
I have previously described how to use the QUAD subroutine in the SAS/IML language to numerically integrate a function. However, using the QUAD subroutine requires that you have some way (often a formula) to evaluate the integrand at an arbitrary point on its domain.
However, sometimes you do not have an explicit function that you want to integrate, but instead you have only a set of N points, which you can think of as being produced by some unknown function (and possibly random noise). The integration problem therefore requires two steps:
- Construct a model that you believe represents the underlying function that generated the points.
- Integrate the function determined by the model.
In my case, I was being asked to find the integral under some (unknown!) curve "defined by" ordered pairs of (x, y) data that were similar to the following:
   x = {0.0, 0.2, 0.4, 0.8, 1.0};
y = {0.5, 0.8, 0.9, 1.0, 1.0}; |
The real data I was given was more complicated, but these data are sufficient to describe the main issues.
Fitting a Curve to Data
One-dimensional integration is finding the area under a curve. But which curve? Do you just connect the points with straight line segments or do you use statistics to do something more sophisticated? Much of parametric and nonparametric regression is the study of how to choose a function (with certain characteristics) that fit the data. Do you believe that the underlying process is linear? Quadratic? If so, least squares regression might be useful. Should you fit a cubic spline to the data? A loess curve?
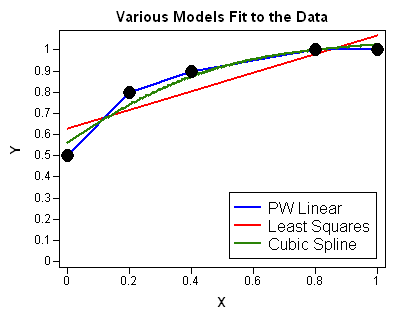
The following image shows several curves that you could fit to a set of five data points: a piecewise linear model, an ordinary least squares regression line, and a cubic spline. There are infinitely many other curves that could fit these points.

Because you can't talk about the area until you determine the curve, you have to use some additional criterion (for example, domain-specific knowledge) to decide on a function that fits the data. Each of the curves in the figure is the graph of a different function, each having a different integral. Once you decide on the curve to use, the area under the curve is determined.
Refining the Question
I went back to the person who asked the question to gather more information. It turns out that the data were actually points on an ROC curve. The person wanted to find the area under an ROC curve, which is a piecewise linear curve that connects the points.
It is common to estimate the area under an ROC curve by using the trapezoidal rule, because the trapezoidal rule gives an exact answer for piecewise linear curves. In fact, this is the method used by the LOGISTIC procedure in SAS/STAT software.
Although the computation is elementary for these data (the area is 0.88), my next post will describe a general implementation of the trapezoidal rule in SAS/IML software.

1 Comment
Pingback: The trapezoidal rule of integration - The DO Loop