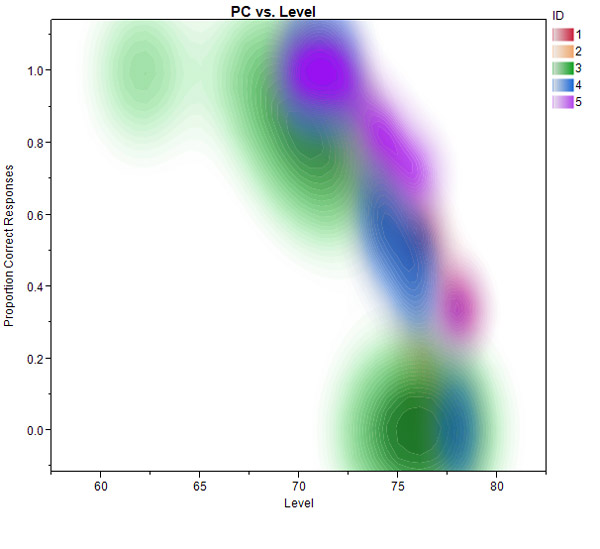
On more than one occasion, I have been asked why we added image functionality to JMP. After all, JMP is a statistical software package. What is the value of imagery and what can you do with images in JMP? Well, there are a number of reasons for adding the functionality,
Tag: Data Visualization
The numbers are in from my SAS colleagues, and I have a list of the top 10 JMP Blog posts of last year. The ranking is based on total number of pageviews. What's interesting is that almost all of the posts on this list were published in years prior to
My kids know I’m a data and stats junkie even if they’re not exactly sure what that means. So naturally, I assume everyone at the dinner table has a solid operational understanding of the terms I use when I’m talking about the latest analysis story, and I’m always a little
A few months ago, a JMP customer contacted JMP Technical Support inquiring about the image functionality in JMP 9. In particular, the customer asked if there was any function that would blend two images together. Tech support forwarded that question to me. I had added some image functionality in JMP
For the last part of this four-part series on graphical output using JMP, I spoke with Brian Corcoran, Director of Software Development, about the exciting improvements in the graphical output options that are in the upcoming JMP 10 release. If you missed the first three installments in this series, be

The best way to make an impact when sharing your statistical discoveries is with compelling graphical output – an area where the data visualization paradigm of JMP is ideal. This four-part blog series will look at some of the options you have for exporting your visualizations created in JMP to
Uncovering structure and patterns in high-dimensional data are challenges easily met using visualization and analytics in JMP. In a Nov. 10 live webcast, Systems Engineer Chris Kirchberg demonstrated how. I captured the presentation as three demos that you can review at your leisure. Each demo is about 20 minutes long,
The holidays are nearing, and you may have a person with a quantitative bent on your gift list. Perhaps that person is an analyst, engineer, scientist or statistician who works in an organization that is ramping up its analytic efforts. Well, here's help with your holiday shopping! It's a list
If you attended the JMP Discovery Summit 2011 in Denver, Colorado, back in September, you may have sat in on my presentation, Image Isn't Everything But It Sure Is Something in JMP 9. I talked about the image functionality that was added to JMP for version 9, and I demonstrated some
Whether you steer strategy from the C-suite or execute operations from your cubical, you can use analytics to transform your organization. I have continued to gain greater appreciation for the value of analytics at the many conferences that JMP has participated in this fall, including Predictive Analytics World in New