
Note from Udo Sglavo: In our previous post, Jan Chvosta, the director of Scientific Computing at SAS, and I discussed the origins of regression analysis and some of the ways it is used today. Now we will further discuss the power of regression framework and choosing the correct regression model.
Udo: In the previous post we discussed the power of the regression framework. In a way, all practitioners are attempting to accomplish a similar task. They want to choose the best regression model and fit it to the data available. It sounds simple in principle but deciding on what is the best might be tricky. How would you go about this in the case of regression analysis?
Jan: In principle, this sounds simple but there is much to be considered in the process. In the first post, we talked a lot about linear regression but in reality, there are many more types that need to be considered. It begins with understanding your data and choosing the right regression analysis type. For example, if your data is binary, logistic regression might be a good choice. There are many questions that need to be asked and decisions that need to be made to choose the right regression model. SAS® Visual Statistics and SAS® Econometrics documentation can help with these decisions. If you are new to regression analysis, Introduction to Regression Procedures can help to get you started.
Udo: We often hear about regression assumptions that are critical for the framework to work. Could you explain what this means?
Jan: These assumptions are crucial because they play an important role in determining whether the model will be a success or failure. Each regression type has its own set of assumptions that you need to consider and evaluate. If they are too restrictive, you might need to think about a different model. For example, if you are fitting a linear regression you need to:
- confirm that the relation between your response and explanatory variables is linear
- your observations are independent of one another
- variance of the residual is constant for all observations
- residuals are normally distributed
Udo: What happens if the assumptions are violated?
Jan: I think we can illustrate this with a situation we face in our daily lives. We might assume that there isn’t a traffic jam during our morning commute to work thus we make it to work on time. If our first assumption is wrong, however, and there is a traffic jam, then our prediction that we make it to work on time is also wrong. It is similar to regression analysis. If we choose the wrong regression model, our parameter estimates, inference about them, and even predictions can be all wrong.
Udo: This seems like a complex problem. Can you provide us with some guidelines on how to choose the correct model?
Jan: There are many ways to go about this and fortunately SAS is here to help. SAS software can address a variety of models based on different distributional assumptions and data complexities. It can also handle tall and wide data, and overall help you with your modeling efforts. You have a set of very powerful tools available. But the success of a modeling effort is often decided even before statistical or econometric modeling starts.
The idea is that you need to understand what you want prior to any analysis, regression or not. You need to ask yourself many questions before you even start fitting a model. For example, you might ask if a simple but interpretable model is more important to you than a more complex model with higher prediction accuracy.
Many questions will point to your data. Are your data observations discrete, count, rare events, independent in time? Do they follow a pattern? Is this analysis univariate or multivariate? In all of these situations, SAS provides robust tools for users to expand their modeling capabilities and predictive modeling power. However, the users play an essential role because they control the modeling process and make important decisions. The questions asked and tools used will also likely depend on the field specialization of the users.
Udo: Are you suggesting that scientists working in different fields would have a different approach to regression analysis?
Jan: Yes, domain knowledge is important. It comes into play when you need to build a sensible and interpretable scientific model. The domain expert tells you what they need from the model. Regression analysis experts (such as statisticians, econometricians, or data scientists) can provide data modeling inputs that are more appropriate to the choice of regression analysis. The domain knowledge is also necessary for correctly interpreting the results. The two need to work hand in hand to achieve a better fit, a better prediction, more robustness, and better interpretability.
Udo: We touched on many important issues and it is wonderful to hear that we have many regression tools available at SAS. Can you provide a high-level overview of these tools?
Jan: Most of our regression tools are available in SAS Visual Statistics and SAS Econometrics. There is certainly more than one way to group these tools. I am going to choose a grouping that follows a frequently used modeling decision process. It also highlights the procedures we have available for each of the areas.
Figure 1 depicts regression procedures in SAS Visual Statistics. They are grouped according to whether the response variable is categorical or continuous, models for means, quantiles, Generalized Linear Models, nonparametric, semiparametric, or parametric approaches.
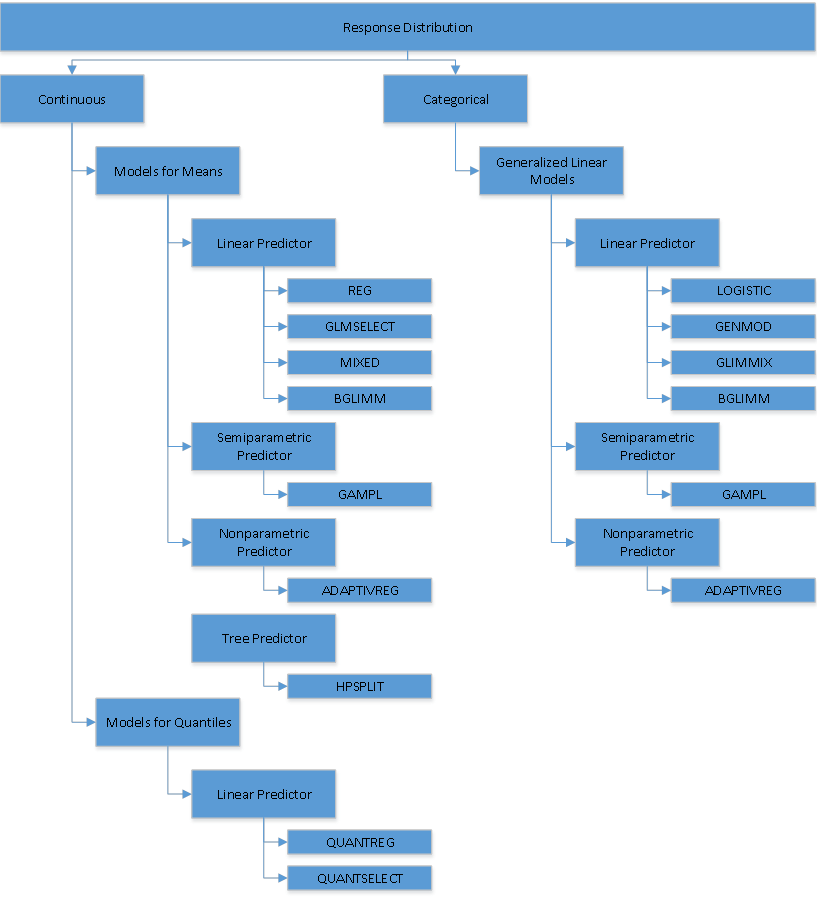
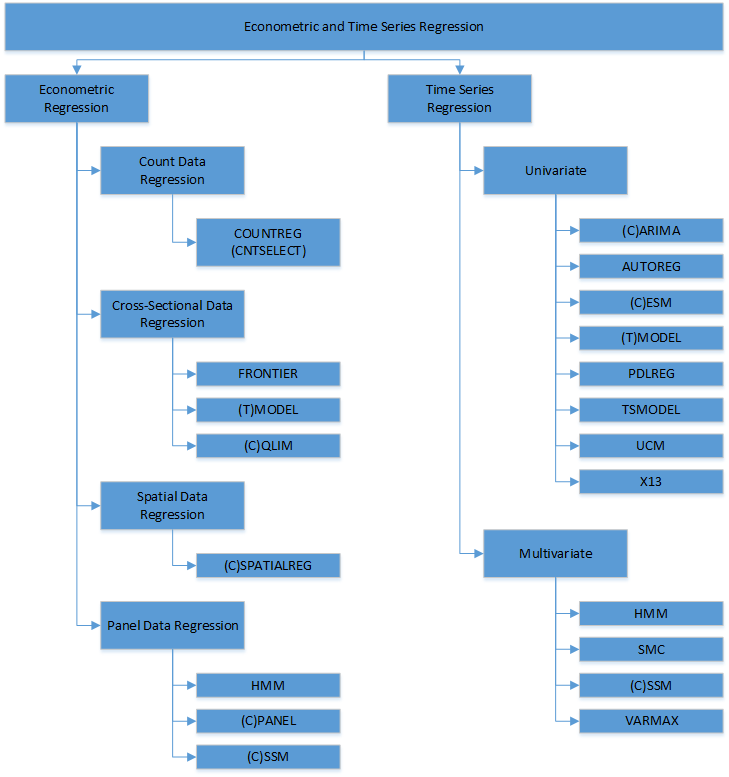
Figure 2 depicts regression procedures available in SAS Econometrics. The econometric regression tools can be grouped into count data modeling, cross-sectional data regression, spatial data regression, and panel data regression. The time series regression procedures can be grouped into univariate and multivariate analyses.
Udo: What are some recent additions to SAS Visual Statistics regression analysis?
Jan: Regression analyses have been enhanced in SAS Visual Statistics and SAS Econometrics in many areas. I will just mention several recent ones.
Causal inference in SAS Visual Statistics is where regression techniques are used to not only model the data but also help in providing valid causal interpretations.
In addition, Bayesian computation regression techniques are implemented in several procedures. This includes the often-used GENMOD procedure that handles generalized linear regression models. As well, the BGLIMM procedure provides regression modeling capabilities to fixed and clustered data. Combining multiple sources of information in a regression analysis brings unique advantages in numerous applications.
Model selection is an inevitable frontier in regression analysis, as the dimensions of the data get to be both incredibly wide and long. SAS/STAT® provides a broad spectrum of tools in helping you to select variables in big data. This ranges from traditional but optimized methods such as forward and stepwise, to shrinkage methods, such as LASSO, SCAD, and MCP, to projective methods, such as principal components regression, to model averaging. These techniques are developed in many regression tools, such as linear, GLM, quantile regression, cox proportional-hazard models, as well as nonparametric and semiparametric additive models.
Udo: Are there also recent additions to SAS Econometrics regression analysis?
In econometrics, the Hidden Markov Models (HMM) is an advanced regression tool for time series analysis. In HMMs, there are hidden unobserved states, and at different states, the observations follow different regression models.
State Space Modeling (SSM) is another quickly growing area in time series because almost all kinds of time series models can be written in the state space form. The CSSM procedure was added to SAS Econometrics in the 2020.1.3 release and will soon introduce scenario analysis, forecasting, and monitoring of streamed data.
Spatial data regression available in SAS Econometrics is another relatively new tool that is quickly gaining popularity. I think it is not that hard to imagine that observations are often spatially dependent and omitting that dependence from your model can impact your results.
Udo: Anything else you would like to share with our readers?
Jan: When it comes to regression analysis, there are many procedures and action sets to choose from. There is a lot to learn and explore. Mastering regression analysis and applying them to your research or business problems will certainly have a great impact on meeting your goals and objectives regardless of your area of interest. With SAS you have a very compelling set of tools available. Learning and exploring them can be fun as well as having a great impact on your business.
For more information on spatial econometric modeling: