 A note from Udo Sglavo: In Digital transformation, scientific computing, and peace of mind, I mention that the COVID-19 pandemic is paralyzing the world. However, new challenges are also inspiring new ideas to tackle those challenges. We might ask questions about what is causal in nature, trying to figure out relationships among various aspects of life. But hang on: didn’t we learn that correlation does not imply causation? In this post, Yiu-Fai Yung, Senior Manager in Scientific Computing R&D, introduces causal analysis techniques and illustrates how we can understand and evaluate the impact of COVID-19 virus on our society. Take it away, Yiu-Fai.
Using COVID-19 data for predictions and causal analyses
Since COVID-19 emerged, scientists around the world have mobilized to address the myriad of pressing issues related to the outbreak. As a statistician who develops software for causal methods and statistical analyses, I ask myself, How can I help people learn from the massive amount of data being collected during this outbreak?
Daily counts of cumulative and new COVID-19 cases, economic indices, citizen compliance rates, and many other statistics from different countries and regions are widely available. Statisticians and data scientists use this information to inform the public about the past and current states of the outbreak.
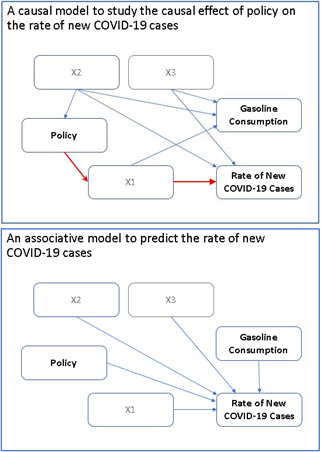
One compelling analysts can use this data is to predict future trends and help people prepare for all possible scenarios. For example, predicting the rate of new COVID-19 cases is an outcome of interest. You may want to know whether the rate of new cases is somehow related to a specific public policy. A predictive model can answer the question with this statement: “Compared with policy A, policy B is associated with a slower rate of new COVID-19 cases.”
But predictive modeling should not be the only goal. You can also take this opportunity to learn about some causal relationships among important variables. A causal analysis answers the same question with this statement: “Compared with policy A, policy B causes (or leads to) a slower rate of new COVID-19 cases.”
A causal analysis aims to estimate causal effects, not just associations. But why is understanding causal relationships important? To create a policy that will lead to a desirable outcome, it must be shown to be a cause of, not just associated with, the outcome of interest. Altering the value of a variable that is merely associated with a target outcome variable does not guarantee a change in the outcome.
For example, the rate of new COVID-19 cases is highly associated with gasoline consumption because of the pandemic policies in various regions of the world. But such an association does not necessarily imply that restricting the supply of gasoline can slow the rate of new COVID-19 cases.
Another example would be finding an effective drug (that is, a treatment variable) that can suppress COVID-19 symptoms (that is, an outcome variable). It is intuitive that what you are trying to establish is a causal, not an associative, relationship.
When to use predictive modeling or causal analysis
To understand how the results of these two techniques can be used, we need to better distinguish the goals of causal analysis and predictive modeling.
Causal analysis learns causal relationships in order to reshape trends; predictive modeling learns about associations in order to predict trends.
A causal analysis estimates a causal effect that is defined as an answer to a question that logically requires the comparison of outcomes under different conditions (such as a treatment vs. a control) in each subject (or research unit). For example:
“What would have been the rate of new COVID-19 cases (outcome) if you were to assign policy B (treatment condition) instead of policy A (control condition) in all regions (research units)?”
To answer this question, you could randomly assign policies A and B to regions. Then compare the outcomes under the two policies. Practically, however, you can only work with observational data in which each region adopts one specific policy.
Without random assignments in the observational data, regions in the A and B conditions might not be comparable in their background characteristics. These characteristics (such as climate, urban density, or demographics) are collectively called covariates in a causal analysis. Confounding covariates induce biases in causal effect estimation; you need to adjust for them in a causal analysis. Figuring out what these confounding covariates are is critical to determining an unbiased estimation of causal effects. Thus, estimating causal effects from observational data is a big idea, but it is certainly not a straightforward endeavor.
In predictive modeling, however, your only concern regarding covariates is whether they predict a designated outcome. To predict the total number of COVID-19 cases for a region in the next few months, you start with a very large set of covariates, such as population density, income level, educational level, various types of public policies, and so on. By applying various machine learning techniques, you end up with a predictive model that uses a much smaller set of covariates as effective predictors of the total number of COVID-19 cases.
Causal analysis focuses mainly on how the treatment causes the outcome, and it adjusts for covariates that account for biases in observations of this causal relationship. Predictive modeling selects the best set of covariates for predicting outcomes.
Comparing causal analysis to regression modeling
How does a causal analysis estimate a causal effect, and how is it different from typical regression modeling?
 These questions cannot be fully answered here without some technical details. Essentially, a potential or counterfactual outcomes framework for defining causal effects is proposed. Under this framework, some assumptions, such as conditional ignorability (or conditional exchangeability), positivity, consistency, and so on, need to be satisfied in order to get unbiased causal effect estimation. One critical assumption is that you must be able to measure all those relevant confounding covariates and adjust for them in causal inferences. The required adjustment due to the confounding covariates can be handled by a whole spectrum of statistical and computational techniques. Here are two well-known classes of methods:
- Propensity score methods with matching, weighting, or stratification
- Doubly robust methods, which combine propensity score methods with outcome modeling
Two recently developed SAS procedures, PROC PSMATCH and PROC CAUSALTRT, implement these methods and deal with all the technicalities in estimation and computation when you specify your causal problem and the relevant confounding covariates. If you suspect that there are unobserved confounding covariates in your observational studies, you can consider using instrumental variable methods procedures, such as PROC MODEL and PROC TMODEL for linear and nonlinear models and PROC PANEL for linear panel data models.
How can you find those confounding covariates in an observational study? Subject matter knowledge is critical to properly answering this question. For example, to study the causal effect of a policy on curbing the spread of COVID-19, it is meaningful to include population density, city design, citizen compliance, numbers of public facilities, and so on, as candidates for confounding covariates. But still, should you include as many of these candidates as possible? What if you have not measured some of them? These are difficult questions to have perfect answers to. But recent research in causal graph theory provides some reasonable answers.
A causal graph is a qualitative representation of the data generating process for an observational study. It summarizes the ways in which the treatment, outcome, and other variables (observed and unobserved) can affect each other. Analysis of a causal graph provides information about statistical strategies that you can use to estimate a causal effect. PROC CAUSALGRAPH can do this kind of graphical analysis. The procedure can identify the valid sets of covariates for adjustment methods (such as propensity score matching, weighting, and doubly robust estimation methods) or instrument variables for instrumental variable methods.
Causal analysis is ambitious in that it attempts to establish causal relationships from observational data. It requires the combined efforts of researchers from different disciplines to carefully consider the data generating process, the set of valid covariates for adjusting biases, and the proper estimation techniques. When data from randomized experiments are not available, causal inferences from observational data can provide valuable insights for solving practical problems.
Predictive modeling and causal analysis complement each other.
If you want to estimate your outcome from an important decision on the basis of the predicted values of the outcome, predictive modeling is an efficient tool. If you want to find a treatment (or intervention) that could change the outcome, causal analysis is an indispensable tool.
Check out these resources to learn more:
- COVID-19 Resource Hub
- Building a Propensity Score Model with SAS/STAT Software: Planning and Practice
- Causal Effect Estimands: Interpretation, Identification, and Computation
- Causal Mediation Analysis with the CAUSALMED Procedure
- Propensity Score Methods for Causal Inference with the PSMATCH Procedure
This is the second post in our series about statistics and analytics bringing peace of mind during the pandemic.