This blog post is part four of a series on model validation. The series is co-authored with my colleague Hans-Joachim Edert.
Most model assessment metrics, such as lift, area under the curve, Kolmogorov-Smirnov statistic or average square error, require the presence of the target/label to be in the data. This is always the case at the time of model training. But how can I ensure that the developed model can be applied to new data for prediction? There may be weeks or even months between model development and model deployment. This means that the distribution of the predictors/features may have changed. Even if model development and model deployment happen quickly, the training data may differ from the new data by sampling (see Figure 1).
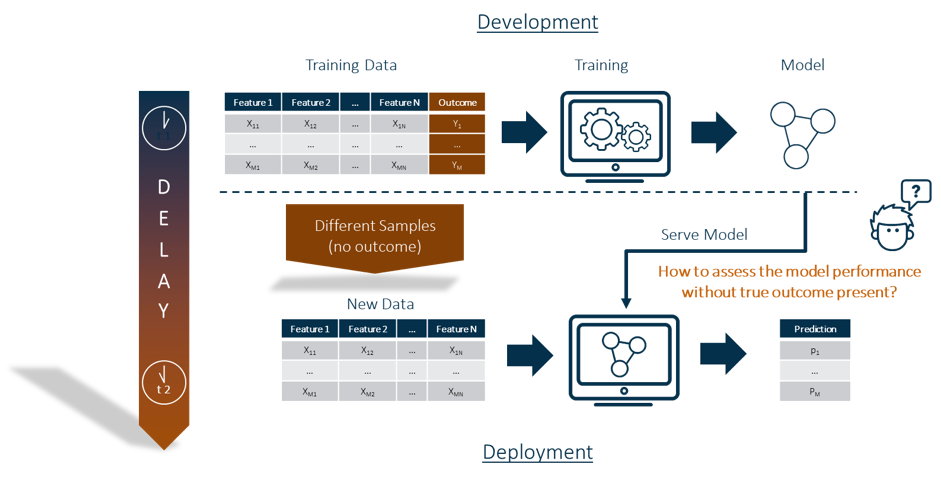
The true outcome, or target/label, is usually not available in the data at the time of model deployment. This means that the usual model assessment metrics cannot be used for model assessment.
The calculation of a feature contribution index allows you to evaluate a model without the presence of a target variable. That makes it suitable for use as an analytical test in a ModelOps scenario, which can be automated. If you're interested in learning more, check out the other posts in our blog series on model validation.
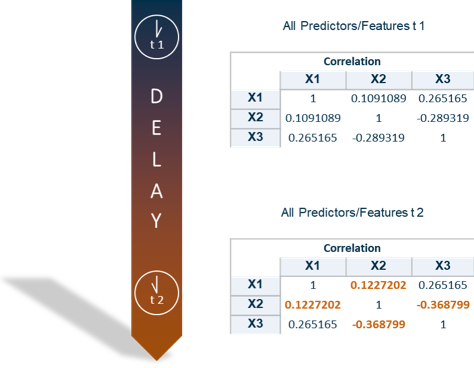
Let’s dig deeper into the idea of the feature contribution index. It's based on the idea that the application of a model to new data is permissible if the associations (both strengths and directions) among the predictors/features of training and new data are similar. We used the correlations to measure the associations. This has the advantage that the values are all between -1 and 1 (see Figure 2).
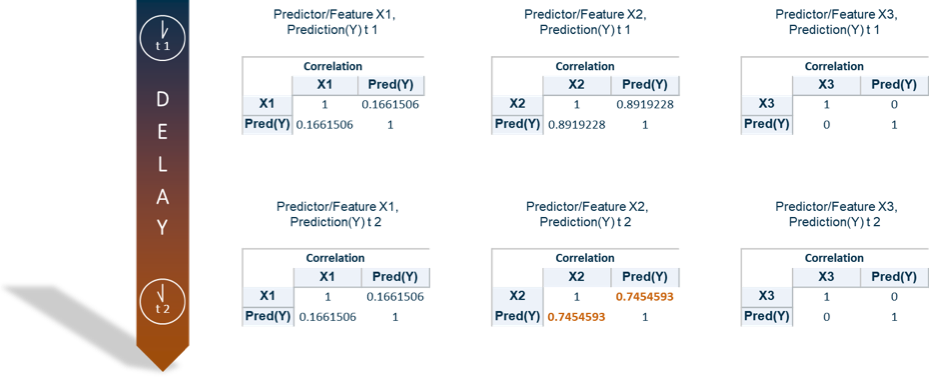
In order to make a statement about deviations for each predictor/feature, the correlation between each predictor/feature and the prediction can alternatively be calculated (see Figure 3).
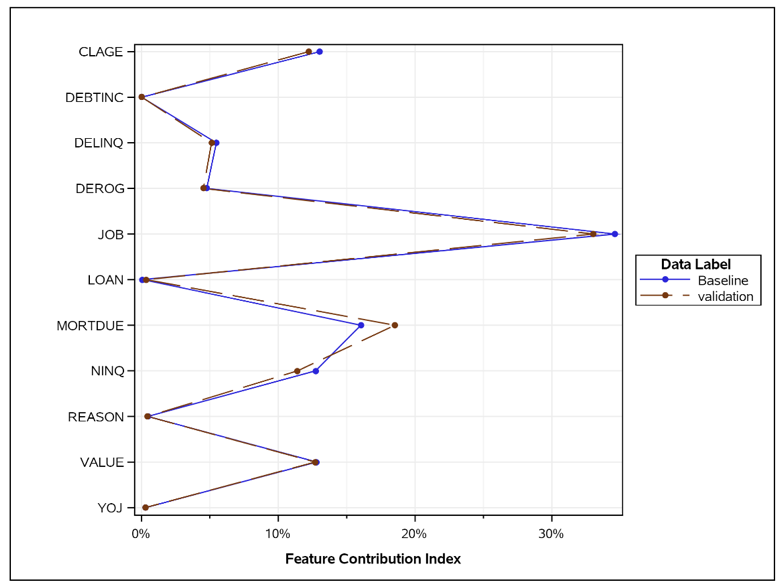
SAS® Model Manager includes SAS macros to calculate the contribution index for each feature. Below you can see an example where the feature contribution index of some predictors/features are plotted for two points in time. You can see that the deviation of the predictor “MORTDUE” is the largest here (see Figure 4). But is it too large?
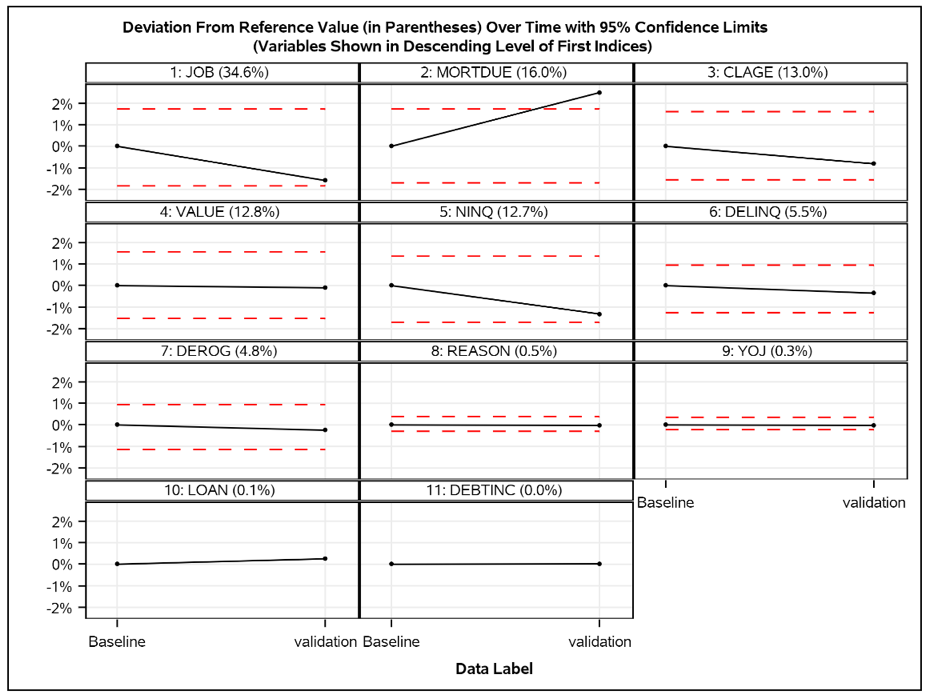
So, now we have to find a way to define the "similar"? How large may the deviation be? Because some random elements are always present in the data and should be allowed. This can be achieved by calculating confidence bands whose limits should not be exceeded, using the Baseline values as the references. The details on how the confidence bands are calculated are beyond the scope of this blog, but can be found in this SAS Global Forum Paper ”Monitoring the Relevance of Predictors for a Model Over Time,”, authored by Ming-Long Lam, Ph.D., who works in R&D at SAS.
In Figure 5 below, only the predictor “MORTDUE” exceeds the confidence limit. All other predictors are within the confidence limits.
With SAS Model Manager 15.3 on Viya the Feature Contribution Index is available with each model monitoring report request. If you'd like more information about SAS Model Manager, visit our Help Center.
Join the virtual SAS Data Science Day to learn more about this technique and other advanced data science topics.