Validating and testing our supervised machine learning models is essential to ensuring that they generalize well. SAS Viya makes it easy to train, validate, and test our machine learning models.
Training, validation and test data sets
Training data are used to fit each model. Training a model involves using an algorithm to determine model parameters (e.g., weights) or other logic to map inputs (independent variables) to a target (dependent variable). Model fitting can also include input variable (feature) selection. Models are trained by minimizing an error function.
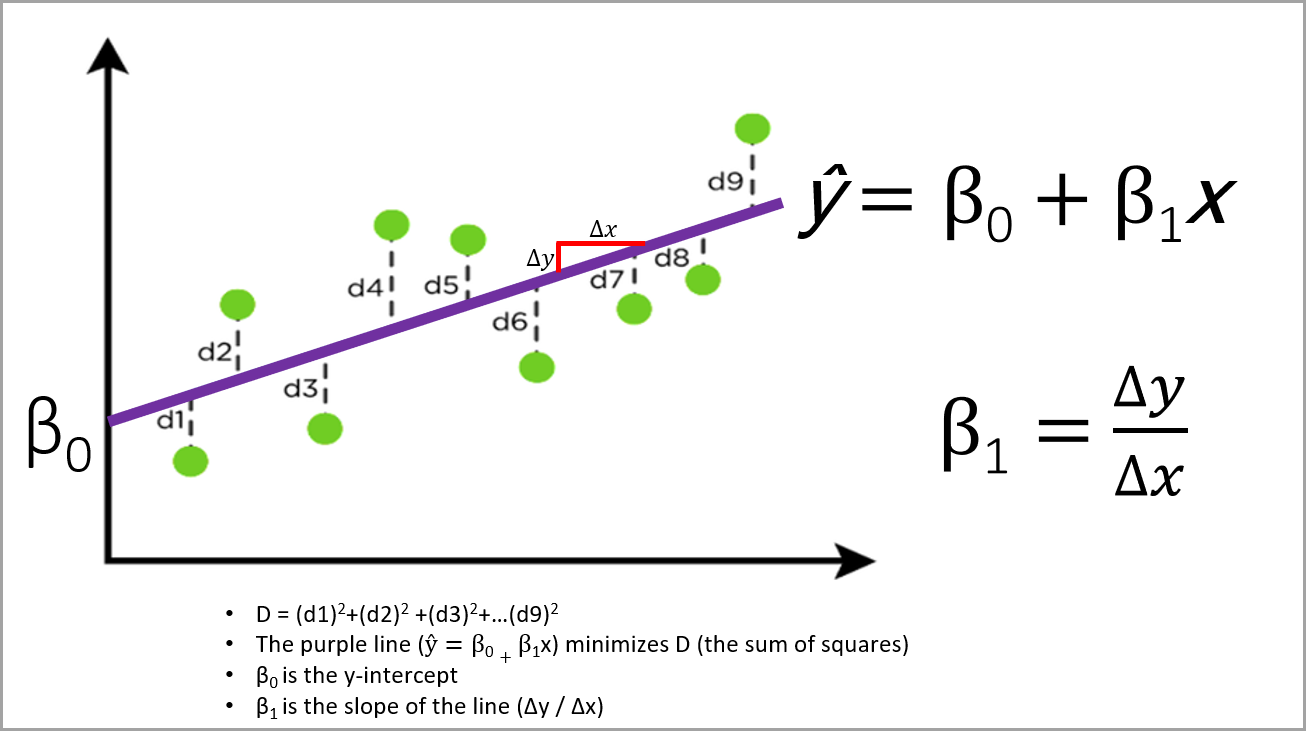
For illustration purposes, let’s say we have a very simple ordinary least squares regression model with one input (independent variable, x) and one output (dependent variable, y). Perhaps our input variable is how many hours of training a dog or cat has received, and the output variable is the combined total of how many fingers or limbs we will lose in a single encounter with the animal.

In ordinary least squares regression, the parameters are estimated that minimize the sum of the squared errors between the observed data and the predicted model. This is illustrated below where the predicted y = β0 + β1x. The y variable is on the vertical axis and the x variable is on the horizontal axis.
Validation data are used with each model developed in training, and the prediction errors are calculated. Depending on the model and the software, these prediction errors can be used to decide:
- When to terminate the selection process
- What effects (e.g., inputs, interactions, etc.) to include as the selection process proceeds, and/or
- Which model to select
The validation errors calculated vary from model to model and may be things such as the the average squared error (ASE), mean squared error (MSE), error sum of squares (SSE), the negative log-likelihood, etc. The validation ASE is often used in VDMML.
Note: “Average Squared Error and Mean Squared Error might appear similar. But they describe two completely different measures, where each is appropriate only for specific models. In linear models, statisticians routinely use the mean squared error (MSE) as the main measure of fit. The MSE is the sum of squared errors (SSE) divided by the degrees of freedom for error. (DFE is the number of cases [observations]less the number of weights in the model.) This process yields an unbiased estimate of the population noise variance under the usual assumptions.
For neural networks and decision trees, there is no known unbiased estimator. Furthermore, the DFE is often negative for neural networks. There exists approximations for the effective degrees of freedom, but these are often prohibitively expensive and are based on assumptions that might not hold. Hence, the MSE is not nearly as useful for neural networks as it is for linear models. One common solution is to divide the SSE by the number of cases N, not the DFE. This quantity, SSE/N, is referred to as the average squared error (ASE).
The MSE is not a useful estimator of the generalization error, even in linear models, unless the number of cases is much larger than the number of weights.”
- From Enterprise Miner documentation.
The validation data may be used several times to build the final model.
Test data is a hold-out sample that is used to assess the final selected model and estimate its prediction error. Test data are not used until after the model building and selection process is complete. Test data tell you how well your model will generalize, i.e., how well your model performs on new data. By new data I mean data that have not been involved in the model building nor the model selection process in any way.
The test data should never be used for fitting the model, for deciding what effects to include, nor for selecting from among candidate models. In addition, be careful of any leakage of information from the test data set into the other data sets. For example, if you take a mean of all of the data to impute missing values, do that separately for each of the three data sets (training, validation, and test). Otherwise, you will leak information from one data set to another.
Partitioning the Data
Simple random sampling: The observations selected for the subset of the data are randomly selected, i.e., each observation has an equal probability of being chosen.
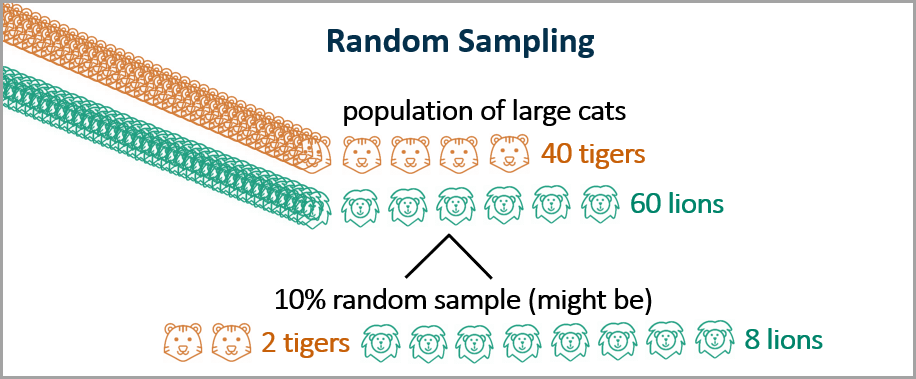
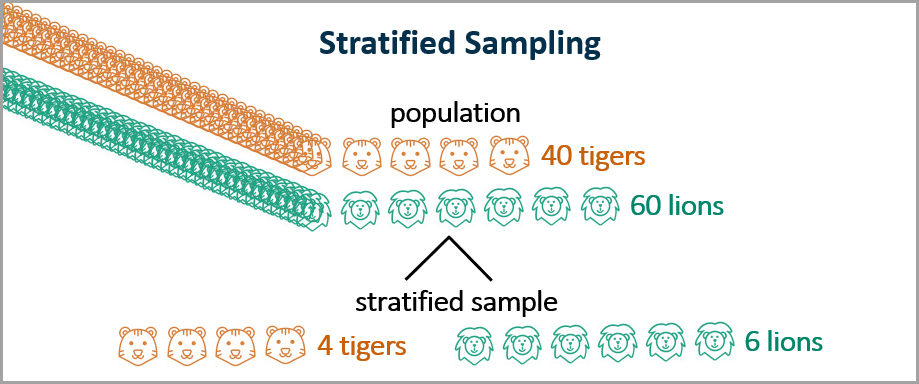
Stratified sampling: The data are divided into segments or “strata,” and then observations are randomly selected from each stratum. For example, for large cat training, you might want to stratify your sample by lions and tigers to ensure that your training, validation, and test data sets all include the proportion of lions and tigers that exist in the total population. As shown below, in this case we take a random sample of 10% of the tigers and a random sample of 10% of the lions.
Oversampling: Oversampling is commonly used when you are looking at rare events, such as cancer cases. You may have a data set with 10,000 people and only 100 cancer cases. You may wish to oversample the cancer cases to get, for example, a 90:10 ratio of non-cancer to cancer cases. You could use 100% of the cancer cases (all 100) and a 9% random sample of the non-cancer cases (900).
How partitioning is accomplished
In VA|VS|VDMML Visual Interface
Partitioning became easier in the VA|VS|VDMML visual interface in 17w47 (December 2017) with VA|VS|VDMML 8.2 on Viya 3.3. To partition data, click the icon to the right of the data set name, and select Add partition data item, as shown below.
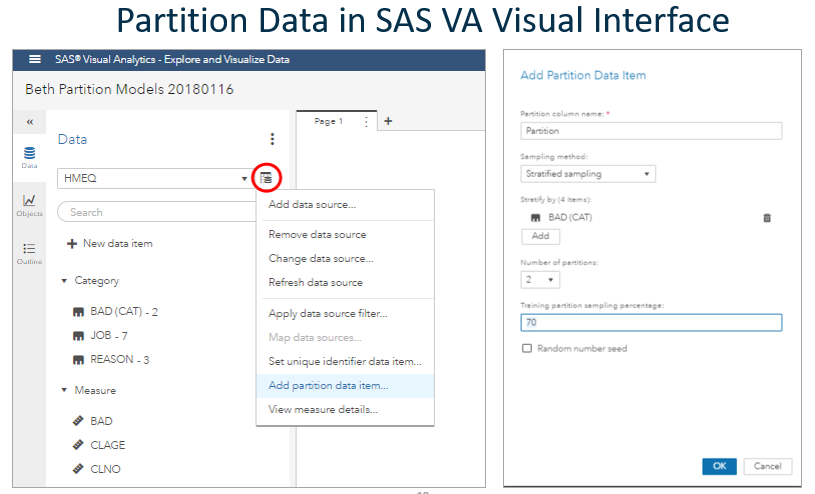
You may select either simple random sampling or stratified sampling and type the training percentage. You may also select a random number seed if you wish.
You may choose:
- two partitions (training and validation) or
- three partitions (training, validation, and test)
They will be assigned numbers as follows:
- 0 = Validation
- 1 = Training
- 2 = Test
Note to anyone dealing with old versions of the software:
In the earlier (17w12, March 2012) release of VA/VS/VDMML 8.1 on Viya 3.2 you needed to have a binary partition indicator variable in your data set with your data already partitioned if you wished to partition the data into Training and Validation data sets. For example, the partition indicator variable could be called “Partition” and could have two values, “Training” and “Validation.” Or it could be called Training and the two values could be 0 and 1. It doesn’t matter what the name of the variable was, but it had to have only two values. As a data preparation step you had to set the partition indicator variable, indicating which value indicates Training observations and which value indicates validation observations. In 8.1, if you did not have a binary partition variable already in your data set, you could not partition automatically on the fly.
There is no rule of thumb for deciding how much of your data set to apportion into training, validation, and test data. This should be decided by a data scientist or statistician familiar with the data. A common split is 50% for training, 25% for validation, and 25% for testing.
Cross-validation is another method, but is not done automatically with the visual interface. For more information on cross-validation methods see: Funda Gunes’s blog on cross validation in Enterprise Miner or documentation on the SAS Viya CROSSVALIDATION statement.
Using SAS Viya procedures
PROC PARTITION lets you divide data into training, validation and test. In addition, most VS and VDMML supervised learning models have a PARTITION statement. (PROC FACTMAC is an exception.) Code for a partition statement within a PROC FOREST could look something like the code below.
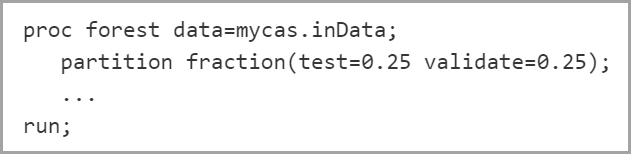
This code would partition the full data set into 50% training data, 25% validation data, and 25% test data.
ALERT: If you have the same number of computer nodes, specifying the SEED= option in the PARTITION statement lets you repeatedly create the same partition data tables. However, changing the number of compute nodes changes the initial distribution of data, resulting in different partition data tables.
You can exercise more control over the partitioning of the input data table if you have created a partition variable in your data set. Then you must designate:
- The variable in the input data table as the partition variable (e.g., “role,” in the example below)
- A formatted value of that variable for each role (e.g., ‘TRAIN’, ‘VAL’, and ‘TEST’ as shown below)
Example code:
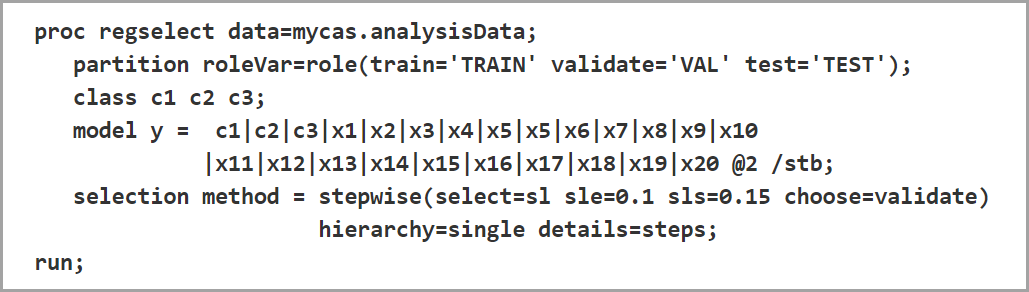
As I mentioned earlier, you can commonly use your validation data set to determine which model to select, or even when to stop the model selection process. For example, this is how you would do that within the PROC REGSELECT, SELECTION statement, METHOD= option:
- Stopping the Selection Process. Specify STOP= VALIDATE. “At step k of the selection process, the best candidate effect to enter or leave the current model is determined. Here, ‘best candidate’ means the effect that gives the best value of the SELECT= criterion; this criterion does not need to be based on the validation data. The Validation ASE for the model with this candidate effect added or removed is computed. If this Validation ASE is greater than the Validation ASE for the model at step k, then the selection process terminates at step k.”
- Choosing the Model. Specify CHOOSE= VALIDATE. Then “the Validation ASE will be computed for your models at each step of the selection process. The smallest model at any step that yields the smallest Validation ASE will be selected.”
– Quoted from PROC REGSELECT documentation
Summary
SAS Viya makes it easy to train, validate, and test our machine learning models. This is essential to ensuring that our models not only fit our existing data, but that they will perform well on new data.
Now you know everything you need to know about training cats and dogs. Go ahead and try this at home. If you are as smart as the dolphins pictured below, you might even be able to train a human!