Customer risk rating models play a crucial role in complying with the Know Your Customer (KYC) and Customer Due Diligence (CDD) requirements, which are designed to assess customer risk and prevent fraud.
Today, the most common form of the Customer Risk Rating model is a score-based risk rating model. This model looks at customer attributes, assigns a score to an attribute, and aggregates those risks into a customer risk score. The aggregation can range from a method as simple as adding or subtracting scores, applying weights before summing up the value, or other sophisticated mathematical methods determined by the financial institution.
After the aggregated scored is obtained, it's mapped to the customer’s risk rating, which usually involves comparing the score to defined cut-off parameters. Finally, the score is derived into three typical risk classes: low, medium or high risk.

The definition of the model and the score is simple enough. In practice, however, you'll find one of the biggest challenges to using the model effectively is deciding how to define weights for aggregation.
A typical method for defining weight is through the heuristic or business expertise approach. For example, a financial institution may feel that the address (or country of the address) is more important in defining risk for the customer than, say, occupation. In that case, the weight of address is set to be higher than occupation. But how much higher: 10%, 25% or 100%?
Once you have decided on the weights, next, you will need to deal with the score cut-off values. This is the score point that separates medium from low and high from medium. The parameter assignment can become somewhat arbitrary. How can we tell if the cut-off value of 40 is better than, say, 30? What value will make our customer risk rating model better? This is the question not only asked by internal auditors but also by regulators. Since a customer risk rating is subject to the compliance for model risk management and governance, financial insitutions are required to validate and justify the definition of the model and its parameters.
The good thing is that you’re not alone. And this article may help you tackle this problem from a different angle, using a data driven approach.
Using optimization to define weights
This article will present the use of mathematical optimization using SAS® Operations Research to find optimum model parameters for the risk-based customer risk rating model. The benefits of this data driven approach include:
- Using math instead of relying on an expert opinion gives you a proof and confidence that the model parameters used are valid and reasonably optimum.
- It works well with large amount of the data. The more data, the better fit the model parameters.
- Deeper optimization: the optimization routine can get to multiple layers / levels of calculation, given there is sufficient data points for the optimization routine to produce reasonable model parameters.
The experiment setup
Before we proceed further, I will create a simple customer risk rating model and an investigator decision process using an Excel file.
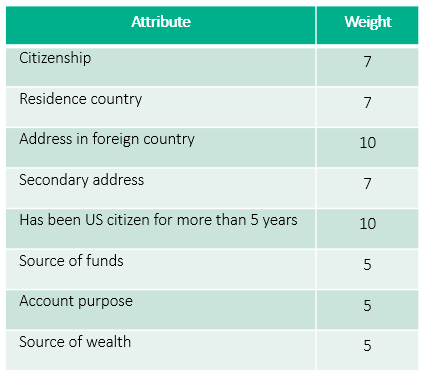
In my simple customer risk rating model, I have 8 attributes as part of the model. each attribute will have the score range between 0 and 100. Below are my 8 attributes:
- Citizenship.
- Residence country.
- Address in foreign country.
- Secondary address.
- Has been US citizen for more than 5 years.
- Source of funds.
- Account purpose.
- Source of wealth.
To simplify this experiment, I'm assuming that score assignments for the attribute values are accurate and aligned with how the investigators define the risk.
Next, I will define a set of heuristic rules that simulate the investigators’ expert judgement.
The first heuristic rule will be the weight. I have set the weight scale between 0 and 10, where 0 means not considered by model and 10 means most important factor for the model.
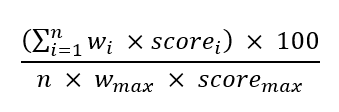
Once the weight is applied, I will normalize the score to be within a 0 to 100 range. This is easily done by dividing the raw score by a maximum score. Then you multiply by 100. In this case, the maximum score will be 8000 (8 x 10 x 100). The formula will be:
The next rule will be a simple decision process to simulate the decision of an investigator. The investigator will define the customer as low risk if the score is between 0 and 20, medium risk if the score is between 20 and 35, and high risk if the score exceeds 35. The value 20 and 35 are medium and high respectively.
To replicate some randomness in the actual investigation, I have added a 10% chance that the investigator may randomly assign a risk rating to the customer to either low, medium, or high without any relevance to the customer’s attribute. The intention for this is to simulate the real-world situation where the investigator may use the information external to the model to make the judgement. One example could be that the investigator has known the customer for a long period and determines the customer is low risk regardless of their risk factors.
As for the data, I have created a total of 300 sample customers to be used in this experiment. The sample customers are randomly generated from the spreadsheet as below:
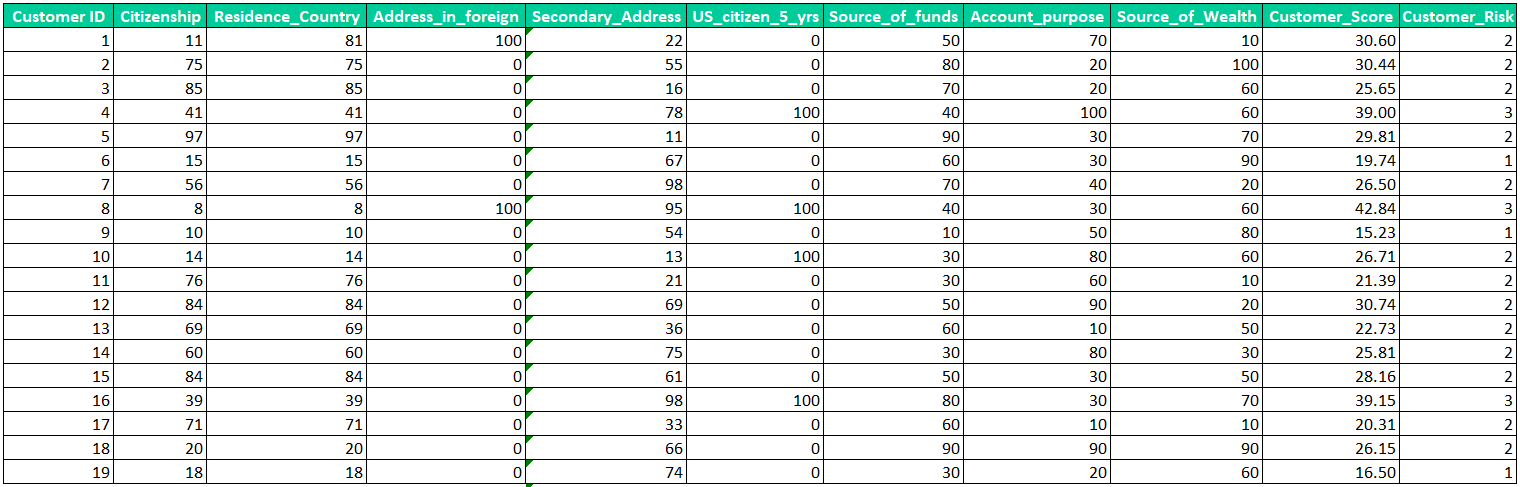
The customer score and customer risk, found in the two right most columns, are calculated using the decision rules explained earlier. The customer score column will be blinded from the optimization routine so that the engine will not know the aggregated score used by investigator in the investigation process. The customer risk rating will be provided to the engine as the reference to represent the “actual” risk rating defined by the investigator that the optimization engine will try to replicate.
Now, I have the sample data for this experiment all set. Next is the use of SAS Operations Research to find the optimum weight and cut-off parameters.
Using SAS® Operations Research to find optimum model parameters
Within the SAS/OR, I must define input, logics (how the model calculates), constraints, and objective.
The scoring calculation logic can be defined as simple as single statement.
The divide by 80 basically comes from the formula where sum of all weighted scores is multiplied by 100 and divide by number of rules (8) times maximum score (100) and maximum weight (10).
The constraints are set to ensure the result will be application to our scoring model. Example of constraints is the weight. The weight in our scoring model needs to be between 1 and 10. I have use 1 instead of 0 because regulator will not want any of the attribute ignored by the scoring model.
There are few other constraints defined to make this work, but it is omitted in order to simplify the explanation.
Next, I need to set objective so that the optimization model will know what the objective of this optimization is. For this optimization, I have set the objective to “minimize the misclassification”.
Once all is set, I simply need to execute the optimization routine. The optimization routine will provide the suggested weights and cut-off values that will minimize the misclassification.
Below are printed results from the optimization routine:
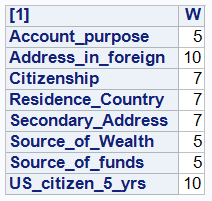
Figure 4: Suggested weights that minimize the misclassification
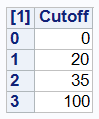
Figure 5: Suggested cut-off values that minimize the misclassification
You may notice that the suggested weights and cut-off values exactly match the simulated decision process that investigator used to decide the customer’s risk rating for this experiment.
The optimization routine suggested that this set of parameters will result in total of 28 misclassifications. This is to be expected as I have set aside 10% of the decision to be made randomly. Hence, the 28 misclassifications out of 300 customers (almost 10%) make sense.
Conclusion
This article has proposed a data driven method to tackle the common problems found in the setting up of the risk-based customer risk rating model: how to define model parameters such as weights and cut-off values. The experiment setup has shown that the optimization routine can come up with a (reasonable) optimum set of model parameters that replicates the decision process made by investigators.
You can consider trying this method for your customer risk rating model to see how much it improves!
Read the latest issue of SAS Statistics and Operations News