This is the fifth and final post in my series of posts about the deep learning model I developed to detect tumors in 3D CT scans of livers. My last post talked about visualizing the results of the computer vision project. This post will cover model accuracy and the final demonstration of the project.
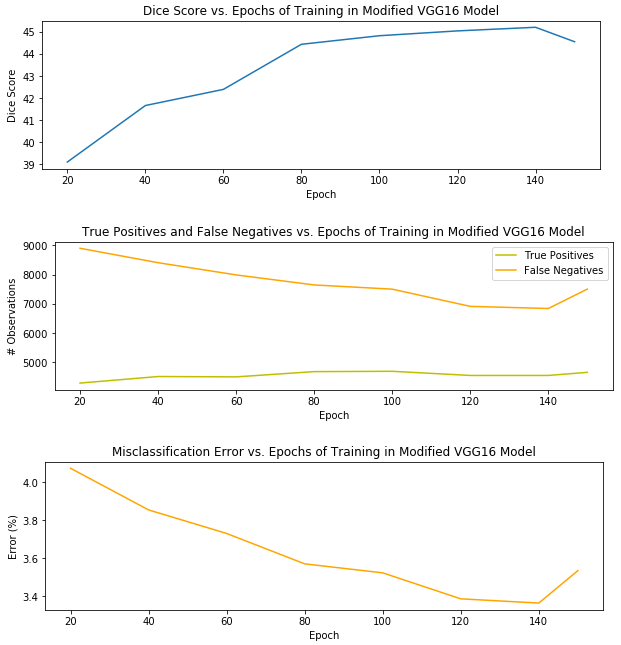
Without many model refinements or segmentation post-processing, the version of my pipeline with the best segmentation performance used a VGG16 model that was trained for 140 epochs and produced a Dice score of 45.20 percent. I’ll explain the Dice score metric in just a moment. Before that, I wanted to provide a visual of the model’s performance on the testing set – a holdout set used for honest assessment of the model during training – – over 150 epochs of training.
It’s clear that overfitting began to occur at 150 epochs, when the misclassification and false positives began to creep up again, and the Dice score began to decrease. Thus, I selected the model after 140 epochs as the best candidate for the pipeline.
What is a Dice score?
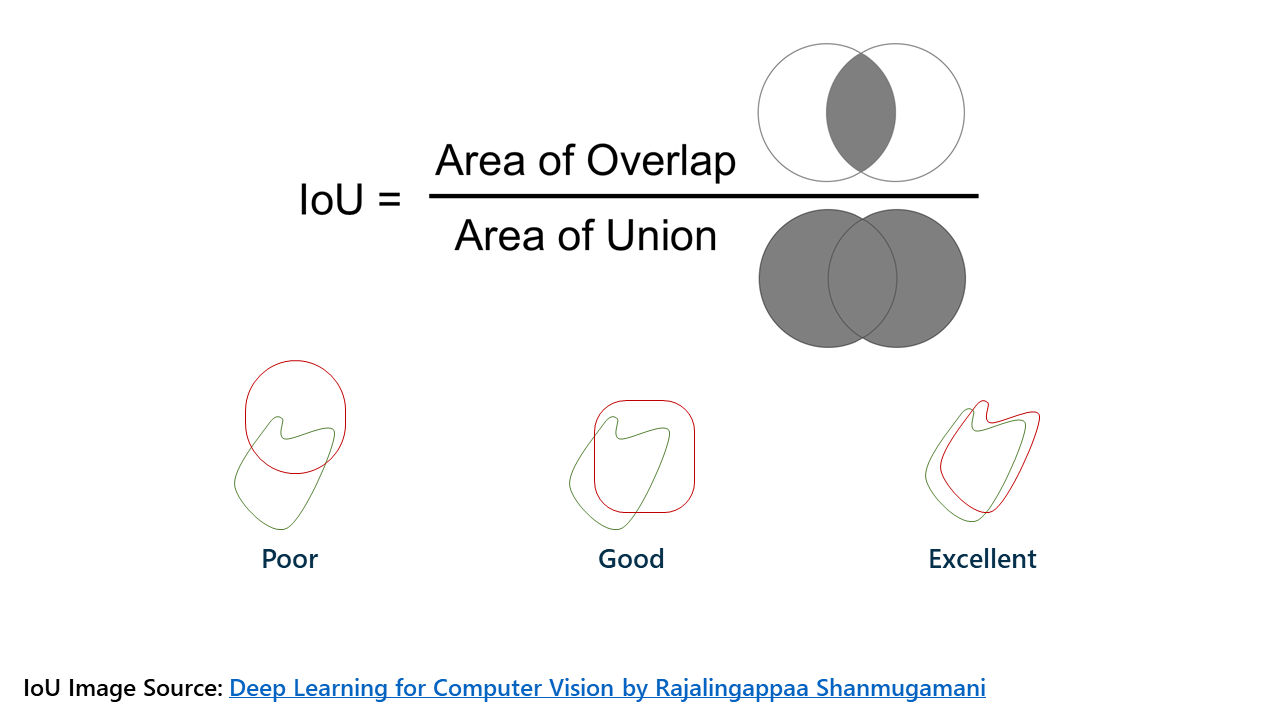
A Dice score, also known as intersection-over-union, is a way to describe the accuracy of machine learning results. The easiest way to describe it is with a Venn diagram.
The left circle is the group of pixels that should be classified as having a lesion; the right circle is the group of pixels that the model ended up actually classifying as lesion. The area of overlap is ideally very large, meaning that the model classified what should be lesions as lesions. The left side of the Venn diagram represents false negatives, or lesion patches that should have been classified as lesion but were not; the right side represents false positives, or nonlesion patches that were classified as lesion but shouldn’t have been.
The Dice score is a more stringent criterion for model accuracy than misclassification, since it does not care about true negatives, which would be the majority of the patches (those that shouldn’t be classified as lesion and weren’t). A Dice score of 45.20 percent without too many pipeline refinements is very promising, as the state-of-the-art Dice score using this approach is around 60 percent!
Presenting model results
When it came time to present my results, I was fortunate to have not only my manager and mentor in the room, but also to present my results to SAS executives and machine learning experts. I talked through the motivation behind the project and its significance, gave an overview, and dove into the code in my Jupyter notebook.
I also provided a quick summary of project highlights, including:
- Building a model with 45.20 percent Dice score accuracy for liver lesion segmentation in 3D CT scans, with no refinements or liver segmentation and limited pre-processing.
- End-to-end, automated data processing and analysis pipeline that lays foundation for future biomedical image analytics in SAS® Viya.
- The very first time CAS capabilities were this extensively tested and applied to a problem with large amounts of data.
- One of the first large-scale applications of SAS Viya to deep learning for biomedical image analysis on real-world data.
- The first time I ever touched deep learning, creating data pipelines, server-side programming, databases, or GPU programming.
- Data manipulation done in memory in CAS, showcasing CAS' strength and standalone capabilities
- Generating a list of requirements for improvements and additional features in CAS and Viya, as well as possible DLPy and other API contributions.
- Working with data from a SAS Partner and illustrating power of SAS Viya to handle messy real-world data and problems.
Future improvements to the project pipeline include implementing the U-Net and 3D convolutions in place of the sliding window approach, as well as post-processing and smoothing of the segmentation using conditional random fields and RNNs or LSTMs to incorporate the third dimension of context from neighboring slices.
During the presentation, the executives and my team members asked questions about my work and challenged me to think beyond the framework I developed and to further explain the motivation behind design choices that I made. It was intellectually stimulating, and has made me hungry for more opportunities to chase my passions and contribute meaningfully to the industry and to the world.
Excited for continued learning
It was an exhilarating experience to not only have done this work, but to be able to present it to industry experts and leaders in the field of analytics, as well as those who weren’t as familiar with computer vision. Being able to present this project and highly technical information to many people of varying backgrounds and interests at once was a challenging, yet very fulfilling experience.
As I’ve discovered, public speaking, machine learning, and applications to real-world problems are definitely shaping up to be a few of my lifelong passions. Through this project, I learned and grew so much as a machine-teacher, programmer, agile scrummer, and lover of deep learning for biomedical image analytics. I'm incredibly enthused for what the future holds, and I am beyond thankful for the investment that SAS and my mentors have made in me.
And, it turns out I like writing articles about technical content, too. Check out my AI-demystifying article and SAS Life blog post on tips to make the most out of your internship. Stay tuned for more, and feel free to connect with me. Until next time, my analytics friends ...