In Part 1 of my series fetch CAS, fetch!, I executed the fetch CAS action to return rows from a CAS table. That was great, but what can you do with the results? Maybe you want to create a visualization that includes the top five cars by MSRP for all Toyota vehicles? How can we accomplish this task? We'll cover this question and provide several other examples in this post.
Save the results of a CAS action as a SAS data set
First, execute the table.fetch CAS action on the CARS in-memory table to filter for Toyota cars, return the Make, Model and MSRP columns, and sort the results by MSRP. Then save the results of the action in a variable using the results option. The results of an action return a dictionary to the client. The fetch action returns a dictionary with a single key, and the result table as the value. In this example, I'll name the variable toyota.
proc cas; table.fetch result=toyota / table={name="cars", caslib="casuser", where="Make='Toyota'", vars={"Make","Model","MSRP"} }, sortBy={ {name="MSRP", order="DESCENDING"} }, index=FALSE, to=5; ... |
After executing the code, the results of the action are stored in the variable toyota and not shown in the output.
Next, use the SAVERESULT statement to save the result table stored in the toyota variable. Since the variable is a dictionary, specify the variable name toyota, a dot, then the fetch key. This will access the result table from the dictionary. Finally, specify the DATAOUT= option with the name of the SAS data set to create.
proc cas; table.fetch result=toyota / table={name="cars", caslib="casuser", where="Make='Toyota'", vars={"Make","Model","MSRP"} }, sortBy={ {name="MSRP", order="DESCENDING"} }, index=FALSE, to=5; saveresult toyota.fetch dataout=work.top5; quit; |
After executing the code, the result table is saved as a SAS data set. The SAS data set is named top5 and saved to the WORK library.
Wondering what else can we do? Let's take a look.
Visualize the SAS data set
Now that the result table is saved as a SAS data set, you can use the SGPLOT procedure to create a bar chart! Consider the code below.
title justify=left height=14pt "Top 5 Toyota Cars by MSRP"; proc sgplot data=work.top5 noborder nowall; vbar Model / response=MSRP categoryorder=respdesc nooutline fillattrs=(color=cx0379cd); label MSRP="MSRP"; quit; title; |
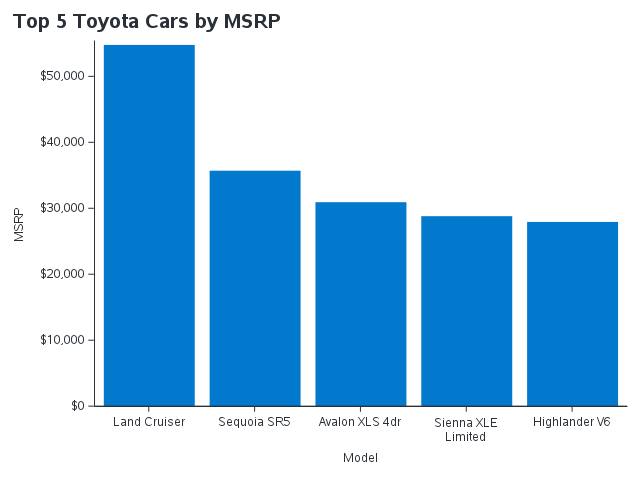
There it is! We processed our data in CAS using the fetch action, returned a smaller subset of results back to the client, then used traditional SAS programming techniques on the smaller table. This method will work similarly in other languages like Python and R. Then you can then use the native visualization packages of the language!
You can now use your imagination on what else to do with the raw data from the CARS table or from the top5 results table we produced with the table.fetch action. Feel free to get creative.
Summary
CAS actions are optimized to run in a distributed environment on extremely large tables. Your CAS table can contain millions or even billions of rows. Since the data in CAS can be extremely large, the goal is to process and subset the table on the CAS server, then return a smaller amount of data to the client for additional processing, visualization or modeling.
Additional resources
fetch Action
SAVERESULT Statement
SAS® Cloud Analytic Services: Fundamentals
Plotting a Cloud Analytic Services (CAS) In-Memory Table
Getting started with SGPLOT - Index
Code used in this post