Using Customer Lifetime Value in your business decision making is often important and crucial for success. Businesses that are customer-centric often spend thousands of dollars acquiring new customers, “on-boarding” new customers, and retaining those customers. If your business margins are thin, then it can often be months or quarters before you start to turn a profit on a particular customer. Additionally, some business models will segment the worth of their customers into categories that will often give different levels of service to the more “higher worth” customers. The metric most often used for that is called Customer Lifetime Value (CLV). CLV is simply a balance sheet look at the total cost spent versus the total revenue earned over a customer’s projected tenure or “life.”
In this blog, we will focus on how a business analyst can build a functional analytical dashboard for a fictional company that is seeing its revenue, margins, and a customer’s lifetime value decrease and what steps they can take to correct that.
We will cover 3 main areas of interest:
- First, screenshots of SAS Visual Analytic reports, using Customer Lifetime Value and how you can replicate them.
- Next, we will look at the modeling that we did in the report, with explanations on how we got used the results in subsequent modeling.
- Lastly, we talk about one example of how we scored and deployed the model, and how you can do the same.
Throughout this blog, I will also highlight areas where SAS augments our software with artificial intelligence to improve your experience.
1. State of the company
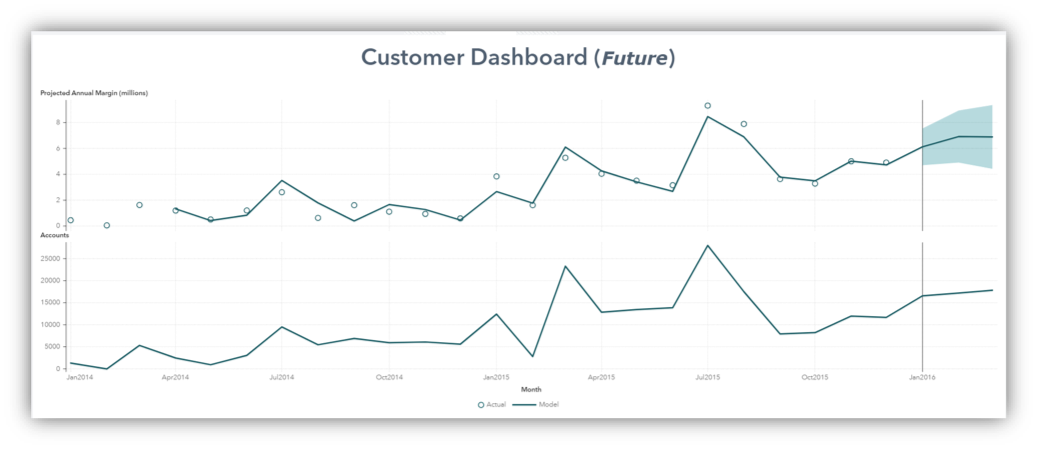
First, we will look at the state of the company using the dashboard and take note of any problems.
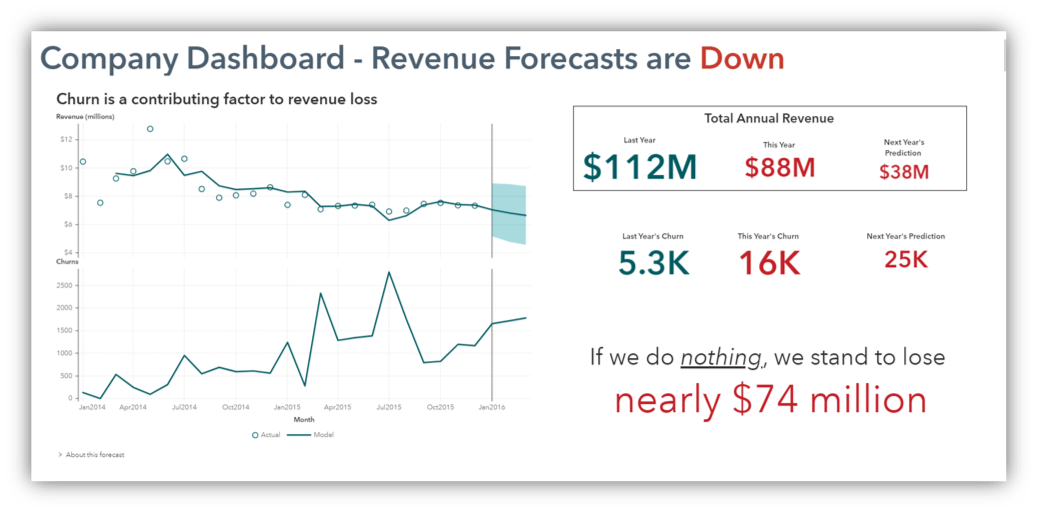
Our dashboard shows the revenue of our company over the last two years as well as a forecast for the next 6 months. We see that revenue has been on the decline in recent years and churns have been erratically climbing higher.
Our total annual revenue was 112M last year with just over 5,000 customers churning.
So far this year, our revenue is tracking low and sits at only 88M, but the bad news is that we have already tripled last year's churn total.
If these trends continue, we stand to lose a third of our revenue!
2. The problems
Now, let’s investigate as to where the problems are and what can be done about them.
If we look at our current metrics, we can see some interesting points worth investigating.
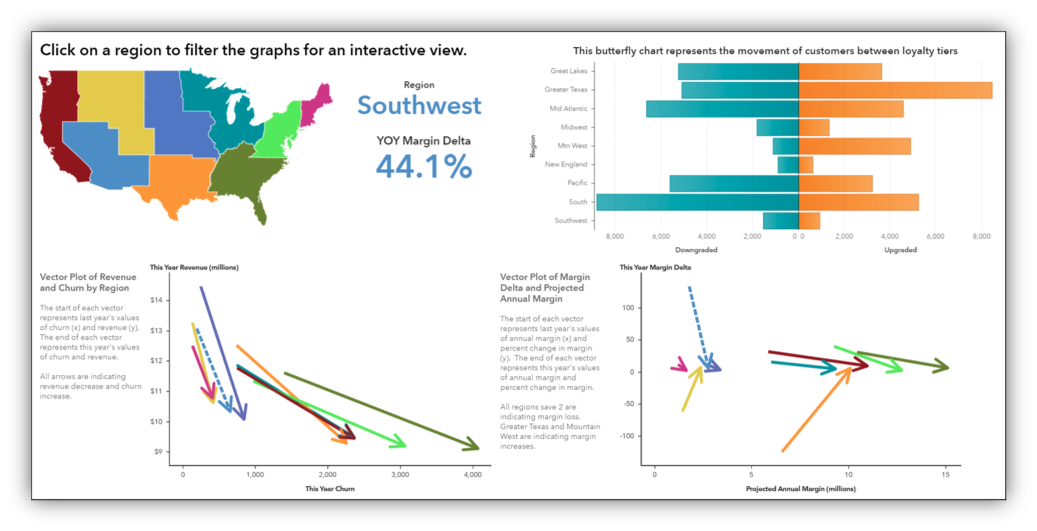
The butterfly chart on the right shows movement between customer loyalty tiers within each region of the country with the number of upgrades (on the right) and downgrades (on the left).
The vector plots show us information over multiple dimensions. These show us the difference between two values and the direction it is heading. For example, on the left, we see that Revenue is pointed downward while churns (x axis) are increasing.
The vector plot on the right shows us the change in margin from year to year as well as the customer lifetime value.
What’s interesting here is that there are two arrows that are pointing up, indicating a rise in customer lifetime value. Indeed, if we were to click on the map, we would see that these two regions are the same two that have a net increase in Loyalty Tier.
This leads me to believe that a customer’s tier is predictive of margin. Let’s investigate it further.
3. Automated Analysis
We will use the Automated Analysis feature within Visual Analytics to quickly give us the drivers of CLV.
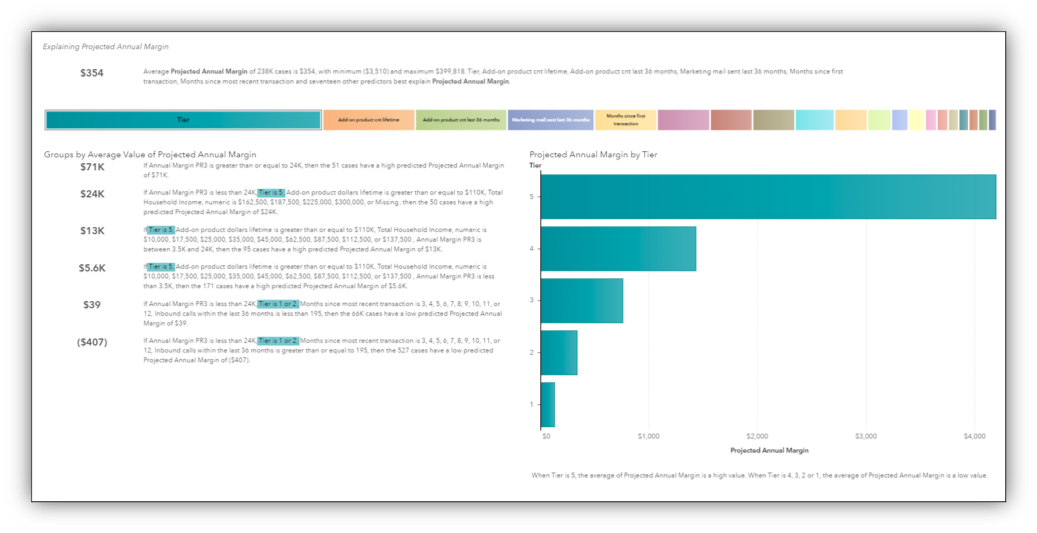
This screenshot shows an analysis that SAS Visual Analytics(VA) performed for me automatically. I simply told VA which variable I was interested in analyzing and within a matter of seconds, it ran a series of decision trees to produce this summary. This is an example of how SAS is incorporating AI into our software to improve your experience.
Here we can see that loyalty tier is indeed the most important factor in determining projected annual margin (or CLV).
4. Influential driver
Once identified, the important driver will be explored across other dimensions to assess how influential this driver might be.
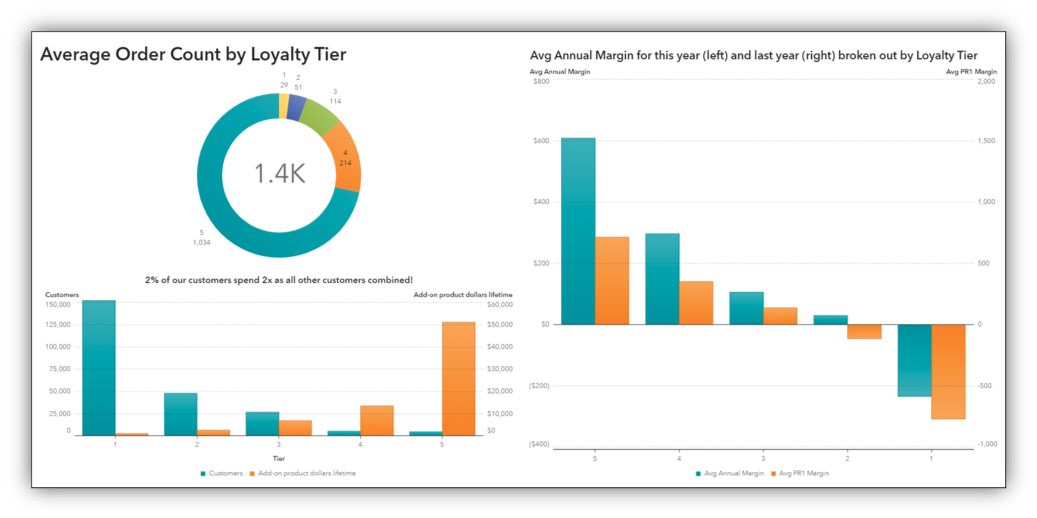
A cursory exploration of Loyalty Tier indicates that yes, loyalty tier, particularly Tier 5, has a major influence on revenue, order count, repeat orders, and margin.
5. CLV comparison models
We will create two competing models for CLV and compare them.
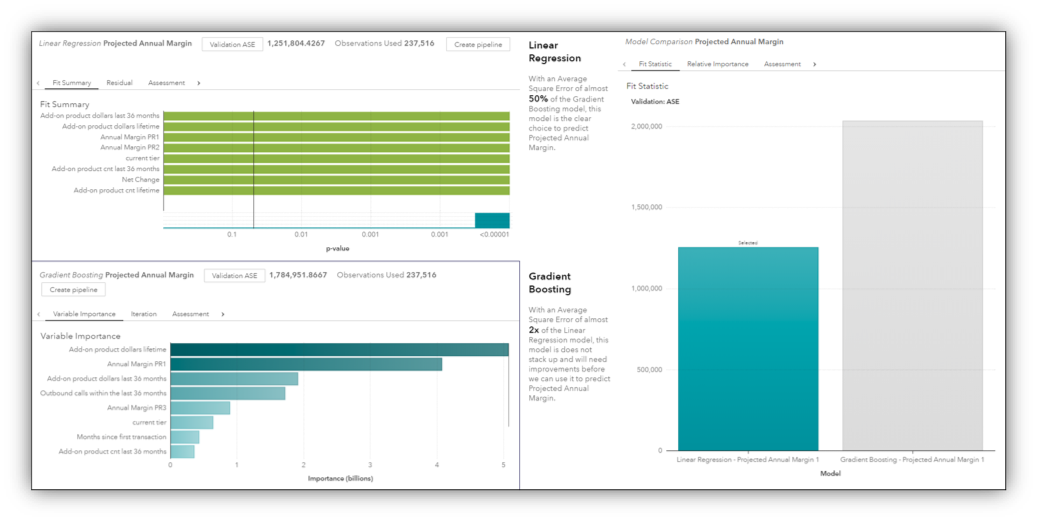
Here on our modeling page are two models that I’ve created to predict CLV. The first one is a Linear Regression and the second is a Gradient Boosting model. I've used Model Comparison to tell me that the Linear Regression model delivers a more accurate prediction and so I use the output of that model as input into a recommendation engine.
6. Recommendation engine
Based on our model learnings and the output of the model, we are going to build a recommendation engine to help us with determine what to do with each customer.
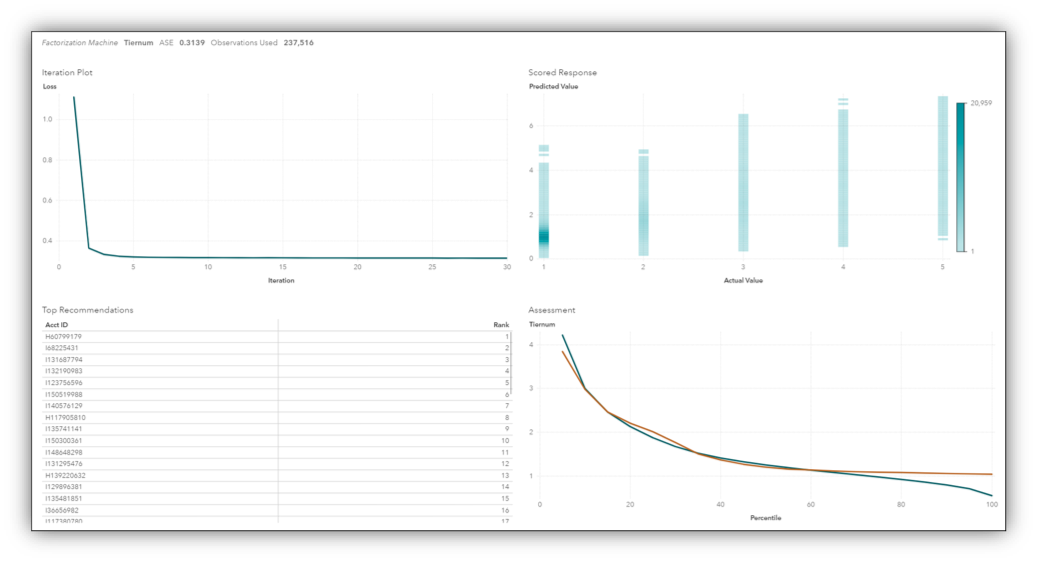
Represented here, I built a recommendation engine model using the Factorization Machine algorithm.
Once we implement our model, customers are categorized more appropriately and we can see that it has had an impact on revenue and the number of accounts is back on the rise!
Conclusion
Even though Customer Lifetime Value has been around for years, it is still a valuable metric to utilize in modeling and recommendation engines as we have seen. We used it our automated analysis, discovered that it had an impact on revenue, we modeled future values of CLV and then incorporated those results into a recommendation engine that recommended new loyalty tiers for our customers. As a result, we saw positive changes in overall company revenue and churn.
To learn more, please check out these resources: