Building on my last post, How to create checklist tables in SAS®, this one shows you how to compare SAS data  sets that include common and uncommon columns. You'll learn how to visualize side-by-side columns commonalities and differences in data tables.
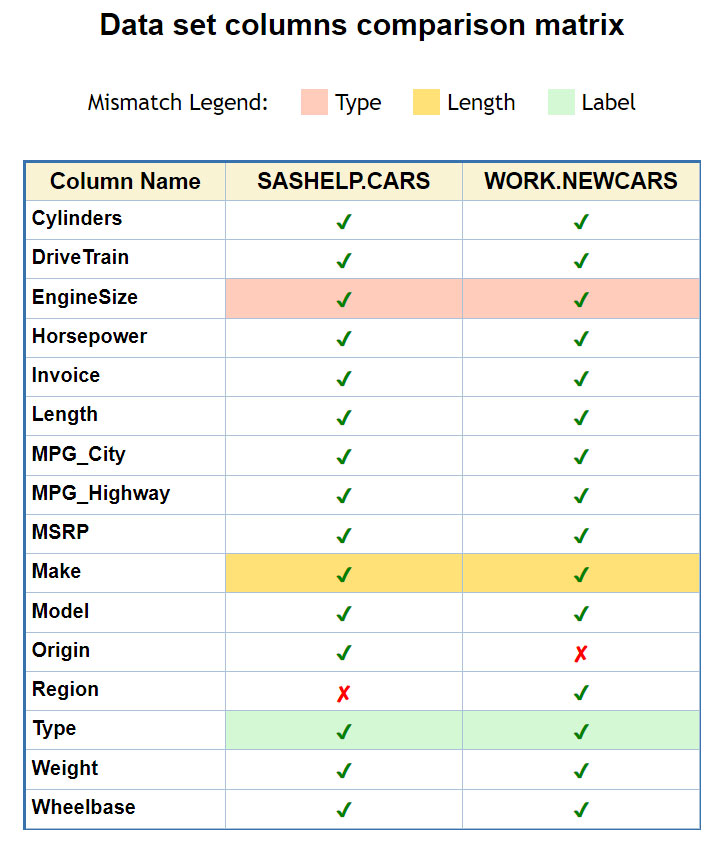
As before, we're working with a comparison matrix (aka checklist table) where check-marks / x-marks indicate included / excluded columns.
Data tables will be comparable products while their columns (variables) will represent product features. We'll add background color to highlight which attributes are different in the common columns. Since there might be several different attributes for a given column, we will use a hierarchy type➜length➜label to indicate only the highest mismatched level of hierarchy. For example:
- If same-named columns have different type (Numeric vs. Character), their corresponding check-mark will be shown on a light-red background, which indicates the highest degree of mismatch.
- If same-named columns have the same type, a yellow background will indicate any difference in variables length.
- When same-named variables type and length match, a light-blue background marks any difference in variables label.
SAS code to create color-enhanced comparison matrix
Let’s compare variable attributes in two data tables: one is SAS-supplied SASHELP.CARS, and another WORK.NEWCARS that I derive from the first one, slightly scrambling its column definitions:
data WORK.NEWCARS (drop=temp:); set SASHELP.CARS (rename=(Origin=Region EngineSize=temp1 Make=temp2)); length EngineSize $3 Make $20; EngineSize = put(temp1,3.1); Make = temp2; label Type='New Car Type'; run; |
In this NEWCARS data table, I did the following:
- Replaced column name Origin with Region
- Changed type of column EngineSize from Numeric to Character
- Changed length of column Make from $13 to $20
- Changed label of column Type from blank to “New Car Type”
Now let’s build the comparison matrix:
proc contents data=SASHELP.CARS noprint out=DS1(keep=Name Type Length Label); run; proc contents data=WORK.NEWCARS noprint out=DS2(keep=Name Type Length Label); run; data comparison_matrix; merge DS1(in=in1 rename=(Type=Typ1 Length=Len1 Label=Lab1)) DS2(in=in2 rename=(Type=Typ2 Length=Len2 Label=Lab2)); by Name; /* set symbol shape: 1=V; 0=X */ ds1 = 1; ds2 = 1; if in1 and not in2 then ds2 = 0; else if in2 and not in1 then ds1 = 0; /* add background color */ if ds1=ds2=1 then select; when(Typ1^=Typ2) do; ds1=2; ds2=2; end; when(Len1^=Len2) do; ds1=3; ds2=3; end; when(Lab1^=Lab2) do; ds1=4; ds2=4; end; otherwise; end; label Name = 'Column Name' ds1 = 'SASHELP.CARS' ds2 = 'WORK.NEWCARS' ; run; proc format; value chmark 0 = '(*ESC*){unicode "2718"x}' 1-4 = '(*ESC*){unicode "2714"x}' ; value chcolor 0 = red 1-4 = green ; value bgcolor 2 = 'cxffccbb' 3 = 'cxffe177' 4 = 'cxd4f8d4' ; run; ods html path='c:\temp' file='comp_marix.html' style=Seaside; ods escapechar='^'; title 'Data set columns comparison matrix'; proc odstext; p '<div align="center">Mismatch Legend:'|| '<span style="background-color:#ffccbb;margin-left:17px">^_^_^_^_</span> Type'|| '<span style="background-color:#ffe177;margin-left:17px">^_^_^_^_</span> Length'|| '<span style="background-color:#d4f8d4;margin-left:17px">^_^_^_^_</span> Label</div>' / style=[fontsize=9pt]; run; title; proc print data=comparison_matrix label noobs; var Name / style={fontweight=bold width=100px}; var ds1 ds2 / style={color=chcolor. backgroundcolor=bgcolor. just=center fontweight=bold width=120px}; format ds1 ds2 chmark.; run; ods html close; |
Here is a brief explanation of the code:
- Two PROC CONTENTS produce alphabetical lists (as datasets) of the data table column names, as well as their attributes (type, length, label)
- The DATA STEP merges these 2 lists and creates DS1 and DS2 variables indicating common name (values 1, 2, 3, 4) or uncommon name (value 0).
- PROC FORMAT creates 3 user-defined formats chmark, chcolor, bgcolor responsible for checkmark shape, checkmark color, and background color respectively. For checkmark shape, we use Unicode characters, and for colors we use both, color names (e.g. red, green) and hexadecimal RGB color notations (e.g. 'cxFFCCBB').
- PROC ODSTEXT’s P statement is used to display color legend for the comparison matrix.
- Finally, PROC PRINT with user-defined formats produces our color-enhanced comparison matrix.
Data tables comparison matrix – OUTPUT
The above code will generate the following HTML output with the comparison matrix for variables in two data sets:
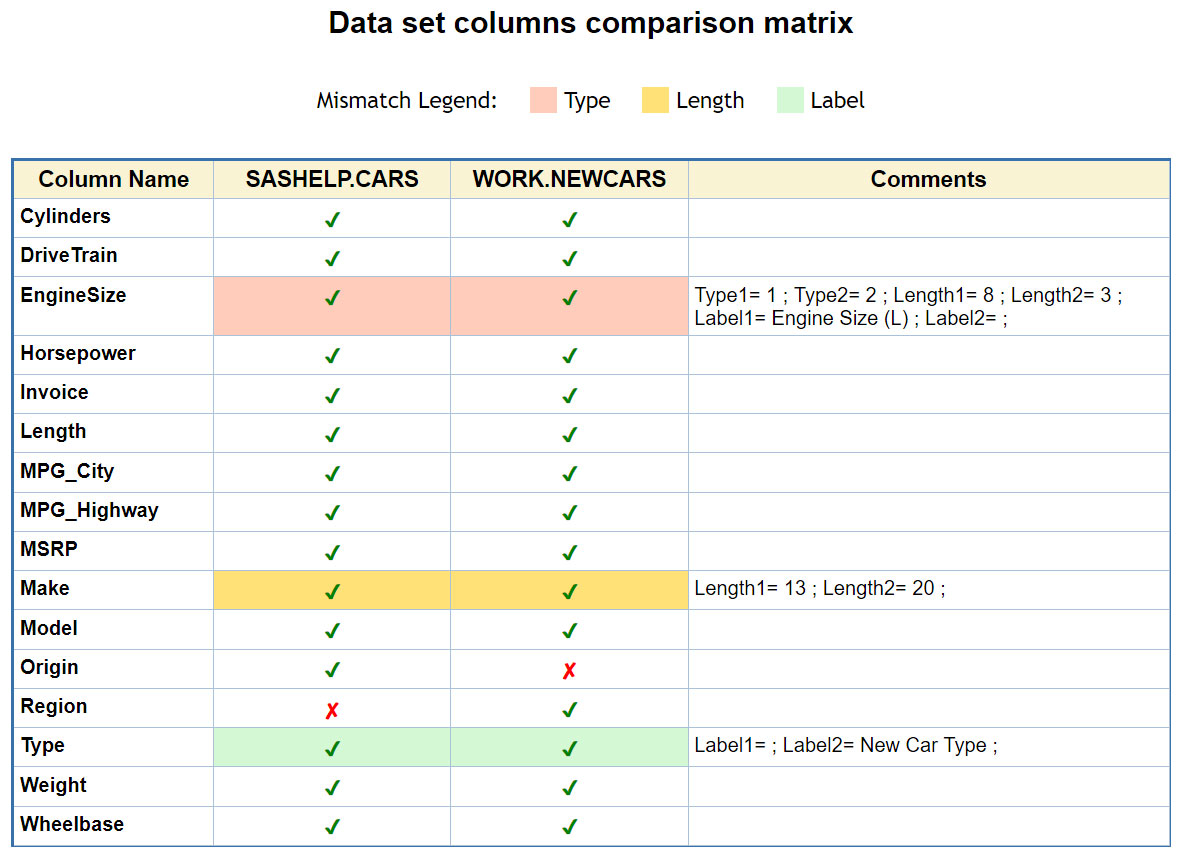
Adding more detail to the comparison matrix chart
We can further enhance our output comparison matrix by adding detailed descriptive information about differences between variable attributes. For comprehensive view, we can add a COMMENTS column that spells out differences (attributes mismatches). In addition to the hierarchical logic defining only one mismatch of the highest degree indicated by color highlighting above, comments can include all found discrepancies. Simply add the following two pieces of SAS code:
1. Add the following group of statements to the above DATA Step (right after SELECT statement):
length Comments $200; if ds1>1 then do; if Typ1^=Typ2 then Comments = catx(' ', Comments, 'Type1=', Typ1, '; Type2=', Typ2, ';'); if Len1^=Len2 then Comments = catx(' ', Comments, 'Length1=', Len1, '; Length2=', Len2, ';'); if Lab1^=Lab2 then Comments = catx(' ', Comments, 'Label1=', Lab1, '; Label2=', Lab2, ';'); end; |
Depending on your needs this Comments can be added unconditionally – you would just need to remove IF-THEN logic keeping only:
length Comments $200; Comments = catx(' ', Comments, 'Type1=', Typ1, '; Type2=', Typ2, ';'); Comments = catx(' ', Comments, 'Length1=', Len1, '; Length2=', Len2, ';'); Comments = catx(' ', Comments, 'Label1=', Lab1, '; Label2=', Lab2, ';'); |
2. Add the following statement to the above PROC PRINT (right before the FORMAT statement):
var comments / style={width=250px};
Then your HTML output will look as follows:
Conclusion
Comparison matrix chart is a convenient data visualization tool useful for data stewardship, development and metadata validation when you're comparing a data table’s metadata against requirements descriptions.
It allows us to quickly identify tables’ common and uncommon variables, as well as common variable inconsistencies by type, length and other attributes, such as labels and formats.
We can easily add detailed descriptive information when needed.
On a related note
While this post focused on visualizing SAS data sets comparison vis-à-vis common and uncommon columns, it's worth noting SAS websites have plenty of info on finding common variables (or columns) in data sets. For example:
- Determining variables that data sets have in common (SAS Note)
- An easy way to find variables in common to data sets (Blog post)
- Find variables common to multiple data sets (Blog post)
Your thoughts?
Do you find this material useful? What other usages of the checklist tables and color-enhanced comparison matrices can you suggest?

32 Comments
Does your code account for uppercase variations? for example, if we have STATE in one dataset and State in another dataset. If not, how can I modify the code to consider these two the same column name?
Thanks!
Great question, Hamed. The way PROC CONTENTS creates its output depends on the SAS system option VALIDAVARNAME. If you want your code to treat columns STATE and State as the same name, you can have the following statement before PROC CONTENTS:
options validvarname=upcase;Hi Leonid,
I want to do validation between 2 datasets based on every column values. It has more than 200 columns and millions of records. Kindly need ur suggestion code
The quickest and simplest way to make sure your datasets are equal (I assume that is what you mean by "to do validation between 2 datasets") is to use PROC COMPARE, e.g.
Thanks Leonid. My concern is how to highlight a values of each variable in both tables that looks different. Eg id in ds1 is 1, in ds2 if it's different 01 then how to highlight the difference. Kindly suggest a code for this
You can use PROC COMPARE with NOPRINT and OUT= options, for example
NOPRINT will suppress printed report and your variable value differences will be captured in the dataset DATADIFFS. Then you can use that dataset to conditionally apply color-coding technique described in this blog post.
Thanks Leonid. Few concerns, columns more than 100 in 2 tables from Hadoop needs to be transposed and dynamically need to check and display sample values in output, for 3 scenarios. In table A, not in B, in B not in A, by macro. Based on key column, will join 2 tables and need to display the values column by column in output that are mismatch in both tables. How do I do this?
For comparing column values your best bet would be using PROC COMPARE. You can also place your problems/questions on SAS Communities at https://communities.sas.com/.
I want to compare two data sets using macro on some condition like first it will check names of columns, and 2nd it will check order of column in both, if matched then compare files. How do I do this?
Hi Shoaib,
For your scenario, column order (position) does not matter. PROC COMPARE will compare two data tables by variable names, not by their positions.
But for my task I am not allowed to use proc compare, instead I should use parametrized macro.
Hi Shoaib, regardless of what you are allowed to use, here is a code example showing how you can compare column names and their orders in two data tables SASLIB1.DATA1 and SASLIB2.DATA2:
You can adapt this to your program accordingly. Hope, this helps.
Hi Leonid, This is a great example to learn. However, I am stuck with creating my report:
I need to create a similar Status check report, but I have to analyze the entire variable. So say for example the entire X variable is blank then I should have a Green tick mark in my table. Can you please help with how to do that?
Hi Harsheel,
Thank you for reaching out. In order for me to be able helping you could you please clarify your task a little more? Do you need to flag each variable that has blank values across all observations in a table? Do you need to display all variables or only those with all blank values? How about numeric missing values? Do you need to cover them as well? Please provide a detail description of what and why you are trying to do as well as the context of this report.
Nice, thank you! I created some time ago code for comparing my data sets. The table was quite wide since included all info about old metadata and new one, plus comparing. I used proc sql (instead of merge in data step), my colorful table was produced by proc report, styles I used conditionally in macro (instead of proc format). I like your neat result! In my current project comparing data sets is the first stage before report about comparing tables by values (deleted, inserted or modified).
Great! Thank you for your feedback, Elena. I am glad that you find this useful, and even more so if you are going to use it in a real-life project.
Yes, I've decided to use big part of your code - I definitely like merging. You manually feel what's going on when combining data, and can pull out needed variables which are "failed". 🙂
👍
Please keep sharing good stories!
This is genius on so many levels! This fits my need (with some modifications & add-on) so well and I also learnt a great many things!
Million thanks to you!
Thank you, Sarthak, for your feedback. Would you mind sharing your use case, modifications and add-on?
I was rerunning some old codes with new data and needed to compare the old vs new datasets. But since the output from proc compare is a bit too wordy and difficult to read(I am a SAS novice), I was looking for a more visual approach and this was a perfect starter and gave an idea.
Next, I started coding for certain summaries printed by proc compare by making them a little more concise (e.g. print descriptive stats instead of row wise comparison for numeric variable). I also color coded the output to show differences in the 2 datasets (e.g. green for higher base value, red for higher compare value and yellow for equal)
I made everything into a macro variable in which I only need to feed the base and compare dataset names, just like the proc compare. I didn't do much, but it certainly satisfies my requirement!
Overall, my intention is to write an upgraded proc compare!
Great, I am glad this blog post sparked your creativity !
Very nice example, thanks. (I made it into a autocall macro!) I have changed it a bit, Mainly it was the format bgcolor that I changed.The colours does not work with me as I'm slightly colourblind, so now it is red, orange and yellow. I also added 0 = pink for missing variables as I did not think that they popped out as much as they should.
Great! I am glad you adapted it for your purpose.
Very nice article..... Now could this be applied to actual data rather than the structure. For example check content of all variables between two datasets for the same unique key? Think Proc Compare but visually
Thank you, Colm, for your great question.
While this blog post addresses comparison of the metadata (variable attributes) the method can be applied to the data as well (as you suggested). If you look at the code in this post, reference to the metadata only exists at the PROC CONTENTS steps. After that, metadata becomes just "data" (DS1, DS2) and it can be any data regardless whether it relates to the metadata or not. For example, if you want to compare two datasets (DS1, DS2) for unique key values of variable KEY you can still use similar logic:
data comparison_matrix;
   merge
      DS1(in=in1)
      DS2(in=in2);
   by KEY;
. . .
However, for large datasets, visualization of all rows may not be practical as you would have to visually browse too much data. For large datasets, more practical solution would be to only keep those rows with different KEY using the following subsetting if statement:
and then outputting them (and possibly displaying) in a table.
And, of course, you can wrap this code in a macro so you can apply it whenever you need to compare any key variable between 2 datasets.
Hi Leonid
Thanks for your reply, and yes I agree that this would not be practical for large sets of data, but think about narrowing down the search. Imagine you have two datasets, one of the production and one the qc dataset. A programmer runs a proc compare and there are differences within some values for some parameters.
Consider the below (hopefully it formats okay). A programmer could call a macro based on imputed values to pull out a section of the results.
So for the above, imagine a macro call such as:
%showme(ds=VITALS, param=TESTCD, where=IF VISIT='SCREENING', show=SUBJECT TESTCD VISIT, resultvar=RESULT);
The code would use the SHOW and RESULTVAR variables as essentially the key/unique vars and produce the above. I do this now but it shows a count of the values per the keys rather than a check/cross. Ultimately this would be really just a wait to produce a fancy report for perhaps less technical people in departments, more visual.
Best
Colm
Thank you, Colm, for sharing your example. Indeed, it would have been a convincing visual to compare values. All you need to do is to calculate STATUS as
Then STATUS will be equal to 1 when the results are equal, and equal to 0 when the results are not equal. Applying formats chmark and chcolor will display STATUS as ✘ and ✔ .
An alternative could be instead of adding STATUS column, just displaying equal results on a light green background, while displaying non-equal results on a light-red background using technique described in this blog post.
This is a great example of a practical solution to a common problem. Thanks!
Thank you, Susan! Maybe that "example of a practical solution to a common problem" will make it to your next edition of The Little SAS Book 🙂
This is a brilliant use of SAS abilities, should be a great comparison tool! Thank you very much Leonid for sharing this with us, your contribution is always greatly appreciated.
Thank you, Rafi, for your nice comment!