Introduction
Generating a word cloud (also known as a tag cloud) is a good way to mine internet text. Word (or tag) clouds visually represent the occurrence of keywords found in internet data such as Twitter feeds. In the visual representation, the importance of each keyword is denoted by the font size or font color. 
You can easily generate Word clouds by using the Python language. Now that Python has been integrated into the SAS® System (via the SASPy package), you can take advantage of the capabilities of both languages. That is, you create the word cloud with Python. Then you can use SAS to analyze the data and create reports. You must have SAS® 9.4 and Python 3 or later in order to connect to SAS from Python with SASPy. Developed by SAS, SASPy a Python package that contains methods that enable you to connect to SAS from Python and to generate analysis in SAS.
Configuring SASPy
The first step is to configure SASPy. To do so, see the instructions in the SASPy Installation and configuration document. For additional details, see also the SASPy Getting started document and the API Reference document.
Generating a word cloud with Python
The example discussed in this blog uses Python to generate a word cloud by reading an open table from the data.world website that is stored as a CSV file. This file is from a simple Twitter analysis job where contributors commented via tweets as to how they feel about self-driving cars. (For this example, we're using data that are already scored for sentiment. SAS does offer text analytics tools that can score text for sentiment too -- see this example about rating conference presentations.) The sentiments were classified as very positive, slightly positive, neutral, slightly negative, very negative, and not relevant. (In the frequency results that are shown later, these sentiments are specified, respectively, as 1, 2, 3, 4, 5, and not_relevant.) This information is important to automakers as they begin to -design more self-driving vehicles and as transportation companies such as Uber and Lyft are already adding self- driving cars to the road. Along with understanding the sentiments that people expressed, we are also interested in exactly what is contributors said. The word cloud gives you a quick visual representation of both. If you do not have the wordcloud package installed, you need to do that by submitting the following command:
pip install wordcloud
After you install the wordcloud package, you can obtain a list of required and optional parameters by submitting this command:
?wordcloud
Then, follow these steps:
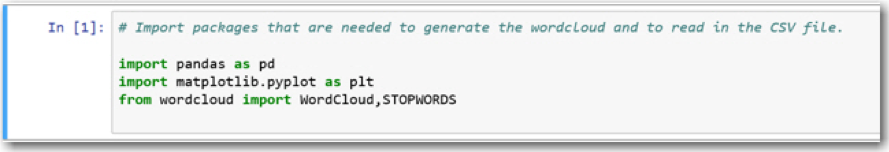
- First, you import the packages that you need in Python that enable you to import the CSV file and to create and save the word-cloud image, as shown below.
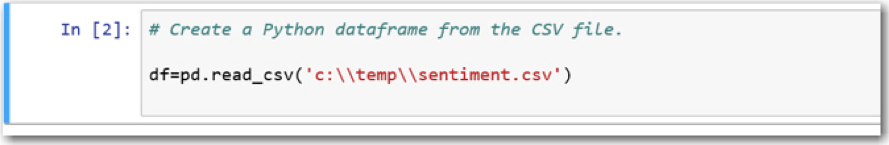
- Create a Python Pandas dataframe from the twitter sentiment data that is stored as CSV data in the data file. (The data in this example is a cleaned-up subset of the original CSV file on the data.world website.)
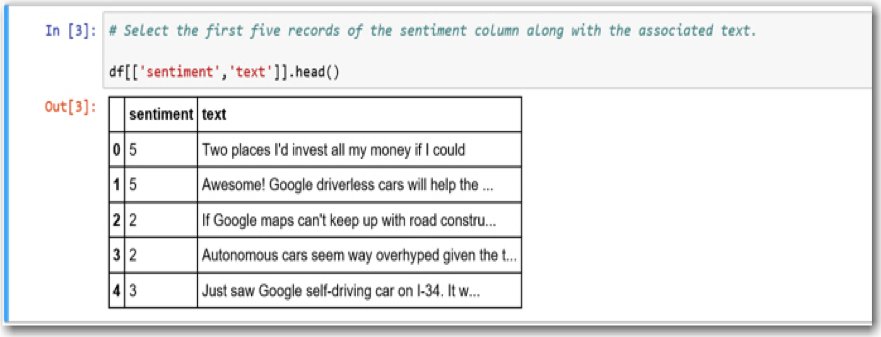
- Use the following code, containing the HEAD() method, to display the first five records of the Sentiment and Text columns. This step enables you to verify that the data was imported correctly.
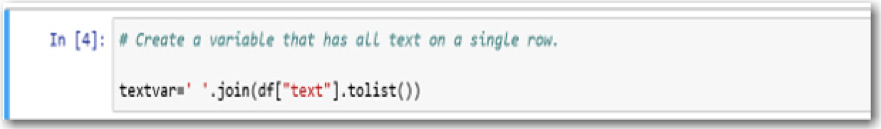
- Create a variable that holds all of the text in a single row of data that can be used in the generation of the word cloud.
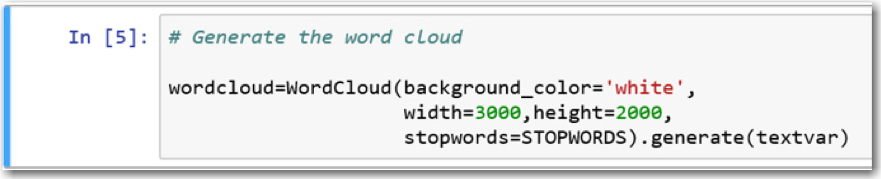
- Generate the word cloud from the TEXTVAR variable that you create in step 4. Include any parameters that you want. For example, you might want to change the background color from black to white (as shown below) to enable you to see the values better. This step includes the STOPWORDS= parameter, which enables you to supply a list of words that you want to eliminate. If you do not specify a list of words, the parameter uses the built-in default list.
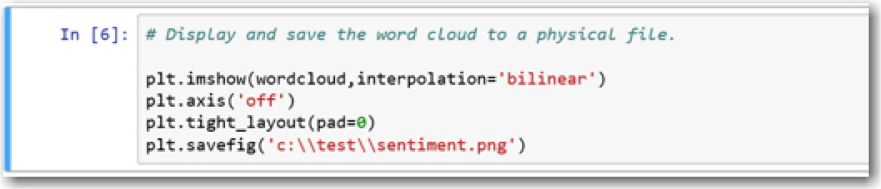
- Create the word-cloud image and modify it, as necessary.
Analyzing the data with SAS®
After you create the word cloud, you can further analyze the data in Python. However, you can actually connect to SAS from Python (using the SASPy API package), which enables you to take advantage of SAS software's powerful analytics and reporting capabilities. To see a list of all available APIs, see the API Reference.
The following steps explain how to use SASPy to connect to SAS.
-
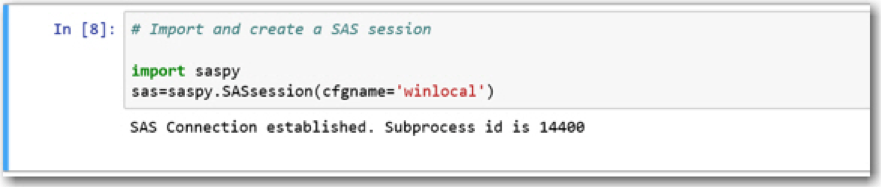
Import the SASPy package (API) . Then create and generate a SAS session, as shown below. The code below creates a SAS session object.
-
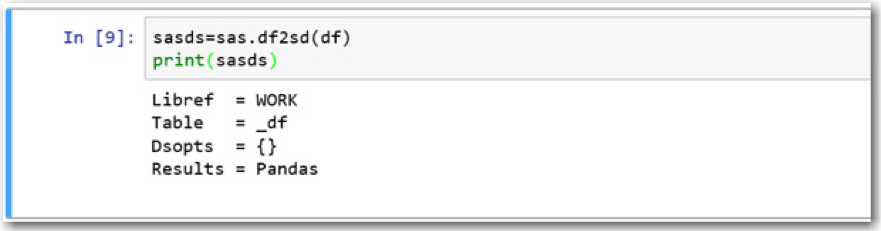
Create a SAS data set from the Python dataframe by using the DATAFRAME2SASDATA method. In the code below, that method is shown as the alias DF2DS.
-
Use the SUBMIT() method to include SAS code that analyzes the data with the FREQ procedure. The code also uses the GSLIDE procedure to add the word cloud to an Adobe PDF file.
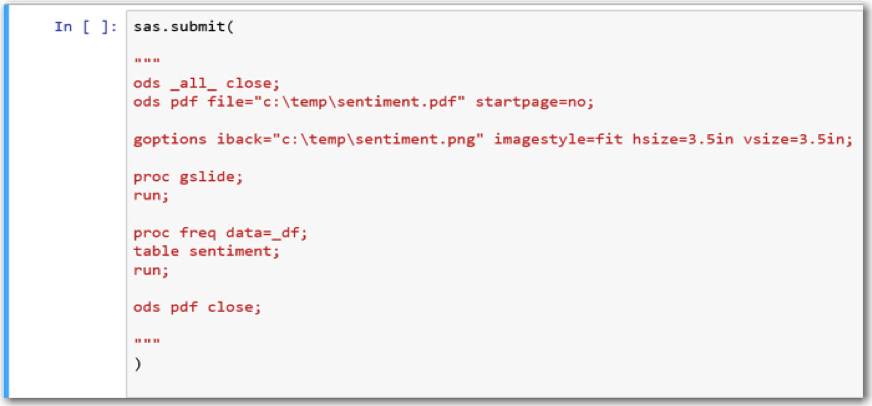
When you submit the code, SAS generates the PDF file that contains the word-cloud image and a frequency analysis, as shown in the following output:

Summary
As you can see from the responses in the word cloud, it seems that the contributors are quite familiar with Google driverless cars. Some contributors are also familiar with the work that Audi has done in this area. However, you can see that after further analysis (based on a subset of the data), most users are still unsure about this technology. That is, 74 percent of the users responded with a sentiment frequency of 3, which indicates a neutral view about driverless cars. This information should alert automakers that more education and marketing is required before they can bring self-driving cars to market. This analysis should also signal companies such as Uber Technologies Inc. and Lyft, Inc. that perhaps consumers need more information in order to feel secure with such technology.

2 Comments
Really cool, Chevell!
I made one too based on your example: https://www.lexjansen.com/cdisc/
Lex
Thanks Lex! This really looks good.