SASPy is a powerful Python library that interfaces with SAS and can help with your machine-learning solutions. 
- Introducing SASPy: Use Python code to access SAS
- SASPy GitHub page
- SASPy Documentation
- SASPy Product Page
This blog post shows you how powerful SASPy can be. SASPy helps you with providing visuals and descriptive statistics quickly and accurately. To demonstrate this capability, let’s explore and prepare your data using SASPy.
Prerequisites
To get started, here is what you need:
- The Census Income data set from the University of California Irvine’s Machine Learning Repository
- Download the adult.data data set from the data folder.
- Remove the missing values prior to exploring and preparing.
- SAS®9.4 or SAS® Viya® 3.1 or any later variations of these
- Jupyter Notebook
- SASPy (To install SASPy, refer to the installation and configuration documentation.)
After verifying you have completed the above requirements, you can start your Jupyter Notebook and begin coding using SASPy.
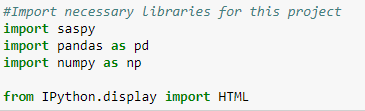
Let's start by importing libraries we will use in this example
- Import the libraries:
- Start your SAS session. Use the command below to establish a connection.
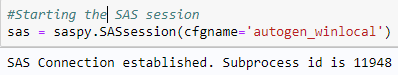
A "SAS Connection established" message returns once connected. This example uses a local connection to SAS. However, you can use an STDIO connection or an IOM connection to SAS if you prefer. For more information, see SAS Configuration.
- Read in your data set. You have two options: You can either read in the data set using pandas and then read the data into a SAS data object or you can read it directly into a SAS data object. This example shows reading the data directly into a SAS data object.
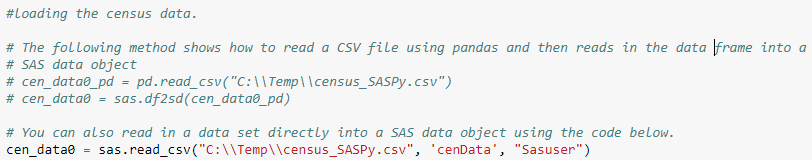
To access existing data in a SAS session, use the SAS data object. A SAS data object can be used to do the following:
- Create various graphs such as histograms, scatter plots, heatmaps, and so on.
- Display descriptive statistics.
- Transfer data in between a pandas data frame and a SAS data object.
The SAS data object is versatile. To view all of its capabilities, refer to the SAS Data Object documentation.
- Verify whether you successfully read in your data set:
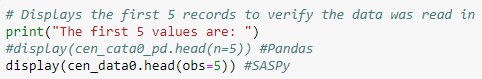
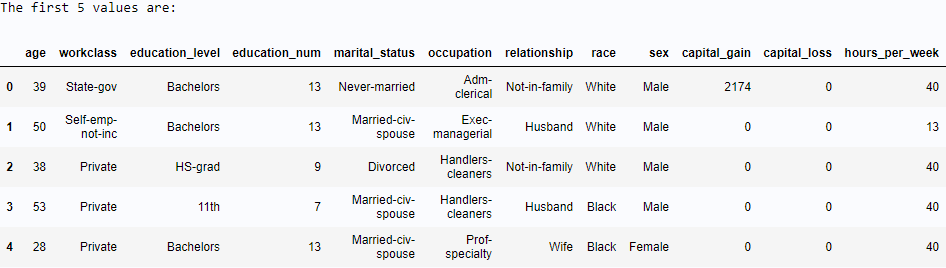
Similar to pandas, SASPy has a head function to display data points. The only difference is when you are specifying how many data points you would like to see. You need to include “obs=n” if you are using a SAS data object.
Exploring your Data
SASPy provides many options to explore your data. This example uses a combination of SASPy functions and pandas to explore the data.
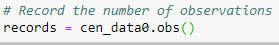
- Determine the number of records in your data:
- Determine how many individuals earn more or less than $50,000. For this step, this example uses pandas to demonstrate how you can switch between using SASPy and pandas seamlessly.
- Change your SAS data object into a pandas data frame:

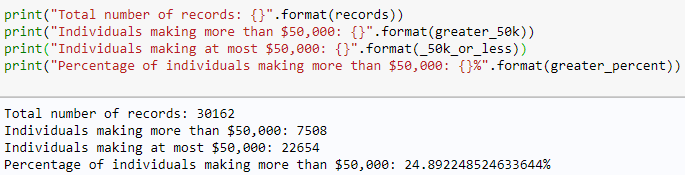
- Use the value_counts function to determine how many individuals earn more or less than $50,000:

- View the percent of individuals whose income is greater than $50,000:

- Display all your values to gain an understanding of your data:
- Change your SAS data object into a pandas data frame:
As you can see from the output above, there are 30,162 records. About 7,508 individuals earn more than $50,000, and about 22,654 individuals make up to $50,000. From all the data, you can see about 25% percent of individuals earn more than $50,000.
- It is also important to look at your numerical features. Use SASPy to get a quick description of your data:

As you can see above, the table lists calculated values for the mean, median, and other valuable statistical values.
Exploring your data is just the first step in generating your machine-learning solutions. This blog post described how to generate basic statistical values and display output using SASPy, pandas, and Python. Part 2 and 3 of this blog post cover how to prepare your data using SASPy and to then apply it to a machine learning model.
For more information about the data set, see the UC Irvine Machine Learning Repository.

4 Comments
Good starting example, and I'm looking forward to the next two. All of your code seems to be from image files. Could you add a link to download your code, or display the code so that we can copy and paste it like a lot of the other SAS blogs?
Hi James,
I will post the code once the three part series is complete. I will more than likely add it to the GitHub SASPy Examples page. https://github.com/sassoftware/saspy-examples.
Thanks for your input.
-Nelson
useful information.thanks.
Thank you! I am glad you found the information insightful.