
Several of my colleagues and I attended the annual Esri User Conference last month in San Diego - along with 18,000 other Geo professionals. It was a busy week of meetings, seminars and talks about the latest in GIS and Spatial technologies. The days were long and exhausting, but it was also exciting and a ton of fun. As we continue to process, plan and prepare to integrate some of these technologies into SAS Visual Analytics, I thought it would be beneficial to highlight the Esri features available in VA today.
One topic that received a lot of questions during this year’s SAS Global Forum in Dallas was that of Geocoding. Geocoding is the process of transforming text address data into numeric latitude and longitude values. Once the latitude and longitude are known, they can be mapped and analyzed spatially. SAS has offered geocoding capabilities for quite some time as a part of SAS/Graph. Beginning with SAS v940m5, PROC GEOCODE has moved into BASE SAS. See my colleague’s blog posts here and here for more information on geocoding from BASE SAS.
But Geocoding is no longer limited to just Base SAS. You can also geocode from within Visual Analytics, thanks to the integration with the Esri geocoding api. This feature is part of the Esri Premium agreement, and became available in VA 8.3. Esri premium features require an existing relationship and credentials with Esri. This post assumes that relationship exists and your credentials have been validated. I will discuss the details of the Esri premium features in a future post, but for today the focus is how to use the Esri Geocoding feature from VA with a real-world data set.
1. Getting the data into Visual Analytics
We will be using point data from the City of Dallas for the Public Library branch locations. You can download the .csv file from the Dallas Open Data portal. After downloading, it must be imported into VA for geocoding.
- From the Data tab in VA, select Import > Local File
- Navigate to the location of the Dallas library .csv file and select it
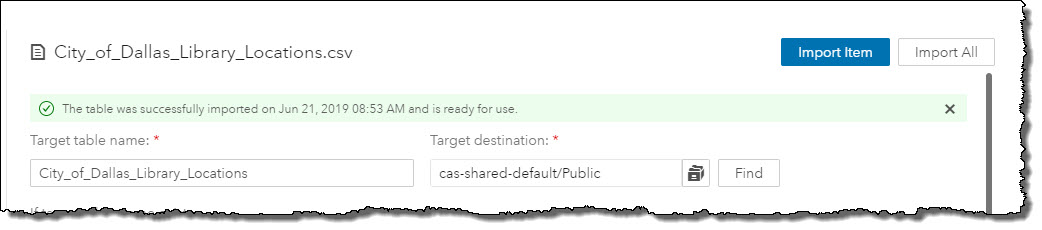
- Adjust the default settings, if desired, and click the ‘Import Item’ button
- Once you see the green success message, the data has been imported into VA and is ready to be geocoded. Click the ‘Cancel’ button
2. Selecting the data columns to geocode on
Accessing the Geocoding feature in VA follows a similar process to the steps we just performed to import the .csv file.
- From the Data tab in VA, select Import > Esri > Geocode. Here, you must select the location of the newly imported library data set. This path will vary depending upon the configuration of your VA instance. For my installation, it is located at cas-shared-default > Public folder > CITY_OF_DALLAS_LIBRARY_LOCATIONS. Once located, click the 'Select' button
- The Geocoding Import window will open. This window should look familiar. The top half is the same as the Import data we just used to get the .csv file into VA. Essentially, the geocoding process is a new data import. It will send selected columns to Esri via a REST api call. The response will contain the corresponding latitude and longitude values we desire. They will be added to our existing data set and imported into VA as a new geocoded data set. The name of the new data set will have _GEO_CODE appended to the end of the original data set name. This name can be modified as desired.
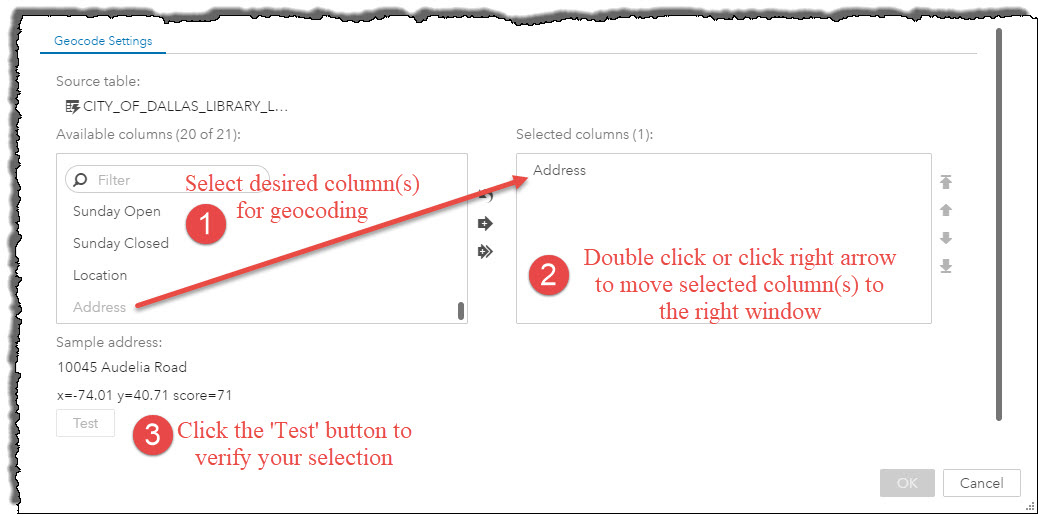
- At the bottom of the Geocoding Import window are two list boxes, Available items and Selected items. The Available items box on the left contains all columns in the data set. Select the column(s) containing the address information you wish to geocode. Double click or click the right arrow to move them to the Selected items window on the right. In this example, we are using the Address column.
- VA concatenates the selected column(s) to generate a sample address for geocoding. Clicking the ‘Test’ button returns coordinates for the sample address and a score representing the confidence level of the results. In the screenshot above, our score is 71/100 for the test address. Not bad, but it could be better. More on this a bit later.
- To finish the geocoding process, click the ‘Import Item’ at the top of the page, as we did with the original .csv file import. This time, you will be presented with a new dialog window. Geocoding, as with other Esri premium features require the use of credits. This dialog indicates how many Esri credits will be used by the geocoding process and will also be discussed in detail in a future post.
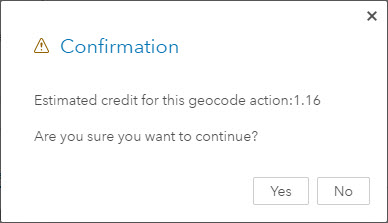
For now, select 'Yes' to continue. When you see the green success message, the operation is complete. We are now ready to map our Dallas Library locations. Click 'Ok' to open the new geocoded data set.
3. Create the geography variable and display the map
Next, we need to create our geography variable from the new geocoded data set. As part of the geocoding process, four new columns have been added to the new data set: esri_latitude, esri_longitude, esri_score, esri_address. We only need the esri_latitude and esri_longitude columns for our map.
- Select the Branch Name category variable and change its Classification to Geography
- For Geography data type, select Custom Coordinates
- Select esri_latitude for Latitude
- Select esri_longitude for Longitude
- Click 'OK'
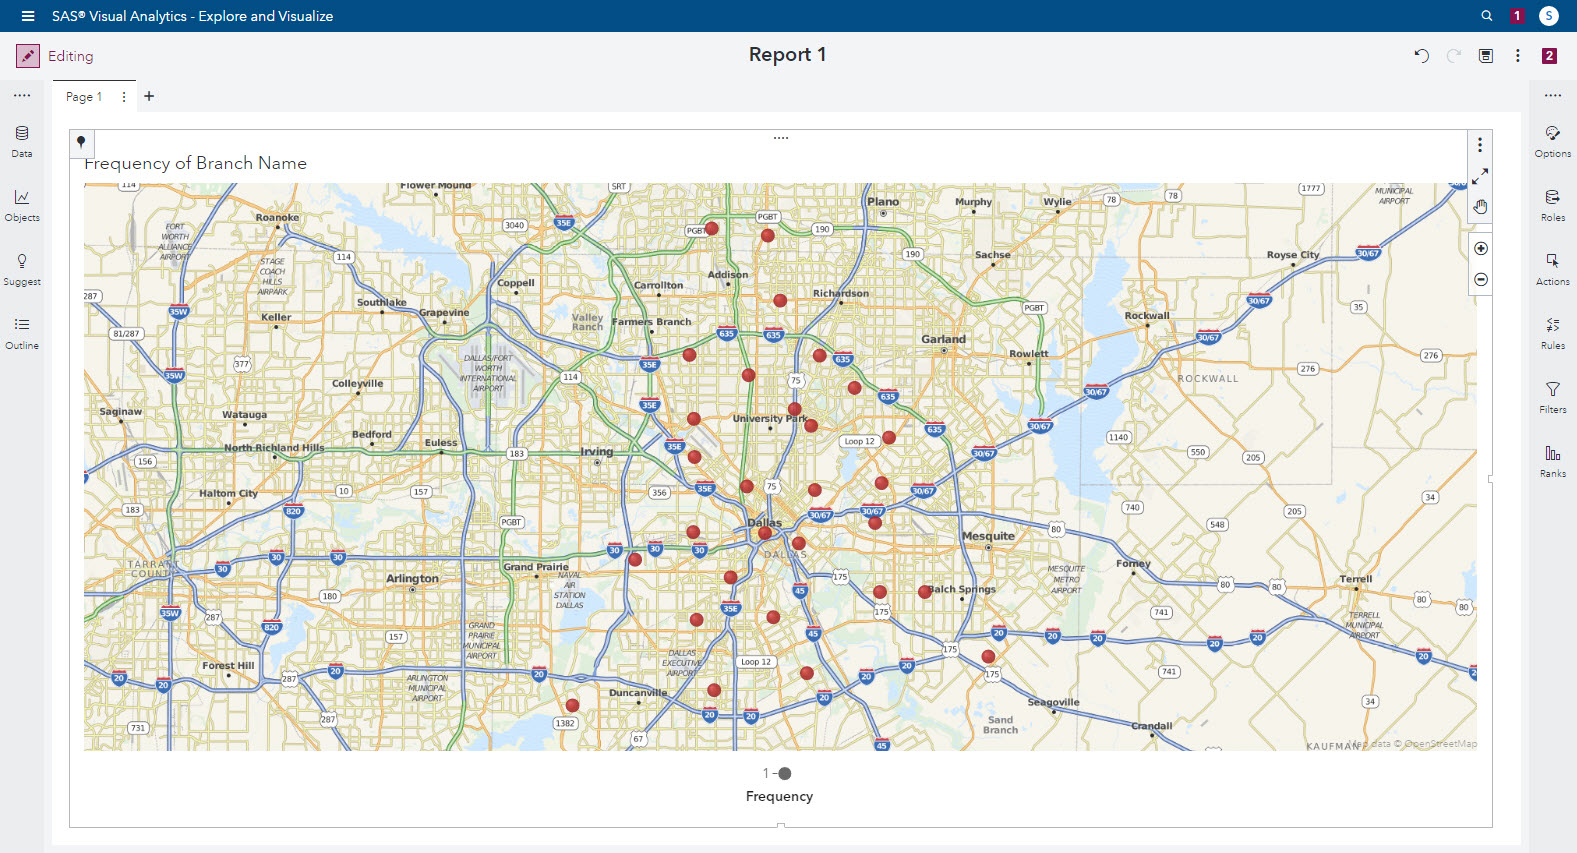
- Drag the Branch Name geography variable to the canvas to create the map
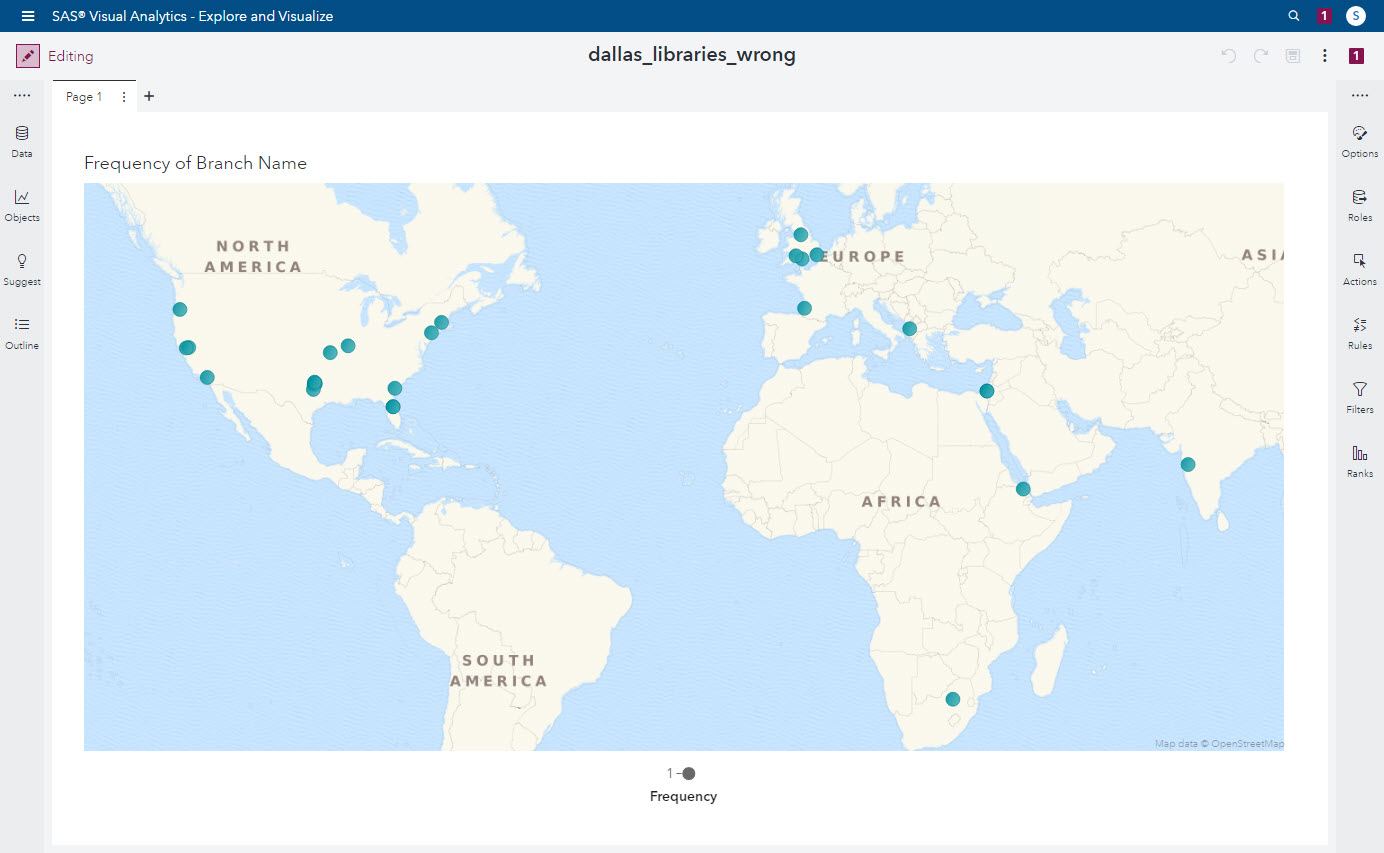
What happened?? Our data set contains Dallas Public library locations, so why are the data points spread across the world? It’s all in the data. If you look at the original data a bit deeper, you will notice the Address field we selected for the geocoding only contains the street number and street name of the library location. It does not contain enough information to make it unique. Therefore, during the geocoding process, the first instance of that address will be considered a match, regardless of where it is actually located.
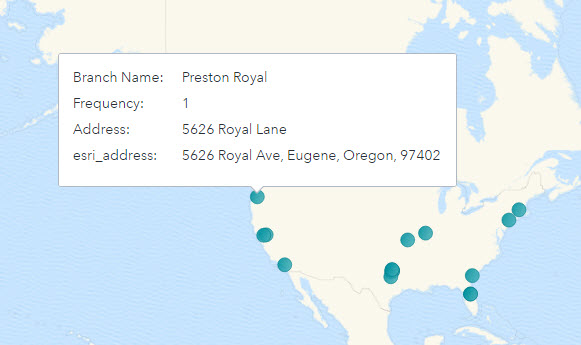
In the image above for the Preston Royal branch, its street number and name were a perfect match to a location in Eugene, Oregon. Not quite what we were looking for. So, how do we fix this? To make our addresses unique, it requires a simple addition to the source data .csv file.
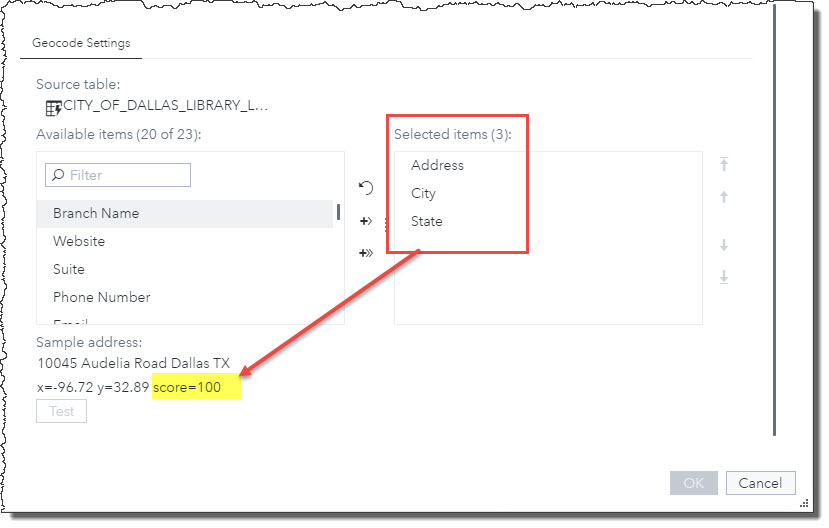
We need to add a ‘City’ and ‘State’ column to the original .csv file with the values of ‘Dallas’ and ‘Texas’ assigned to all entries. This will ensure each address is unique and within our area of interest. Re-import the new .csv file and geocode it using the Address, City and State columns. The result? A confidence score of a perfect 100. Much better than our first attempt! This will now give us the map we desire for the Dallas Public Library locations.
In this post, I used real-world data to illustrate two things: the importance of knowing your data set, and how to geocode address information in SAS Visual Analytics. Public data sets are a great resource but need to be used with a critical eye. They may still need additional cleansing in order to work for your situation.
The geocoding feature is one example of the premium Esri features currently available in VA. In future posts, I will go into more detail on other Esri features available, what make these features ‘premium’ and examples of how to use them. Stay tuned!

2 Comments
Interesting. We worked on a global geocoding problem recently for nearly half a million locations. We used elastic search with fuzzy matching in public databases, clustering of known groups and some manual investigation of common mismatches. We found many difficulties with global addresses, for example different transliteration standards (Korea, Thailand), use of "folk" abbreviations (UK, Germany), names of regions which have been superseded (France), missing ISO standard region codes in the global databases (many countries), locations identified by a distance along a road (Brazil), variable use of spaces, hyphens and accents (Germany and others) and of course simple typing errors and wild abbreviations (12 variants of Baden-Württemberg). How good is the ESRI solution with a global dataset? We might have the ultimate stress test.
Hi Peter - Great question. I don't have enough experience with global geocoding to answer your question specifically. Esri has put significant effort into their global geocoder, so it may be a viable option for you. However, with the volume of locations you are working with, I would look closely at the credit usage that would be required. According to Esri's website (here), geocoding uses 40 credits per 1,000 geocodes, so this could become a non-trivial cost quickly. Exactly how this translates into dollars would depend upon your Esri agreement.
If city or postal code level geocoding works in your situation, you may be able to off load some of the work to PROC GEOCODE to reduce the Esri credit usage. See the following links for information on loading and using postal code lookup data for England, Australia, Canada, and other countries with PROC GEOCODE. SAS Maps online - Geocoding | SAS Geocoding docs