Across organizations of all types, massive amounts of information are stored in unstructured formats such as video, images, audio, and of course, text. Let’s talk more about text and natural language processing. We know that there is tremendous value buried in call center and chat dialogues, survey comments, product reviews, technical notes, legal contracts, and other sources where context is captured in words versus numbers. But how can we extract the signal we want amidst all the noise?
In this post, we will examine this problem using publicly available descriptions of side effects or adverse events that patients have reported following a vaccination. This Vaccine Adverse Event Reporting System (VAERS) is managed by the CDC and FDA. Among other objectives, these agencies use it to:
* Monitor increases in known adverse events and detect new or unusual vaccine adverse events
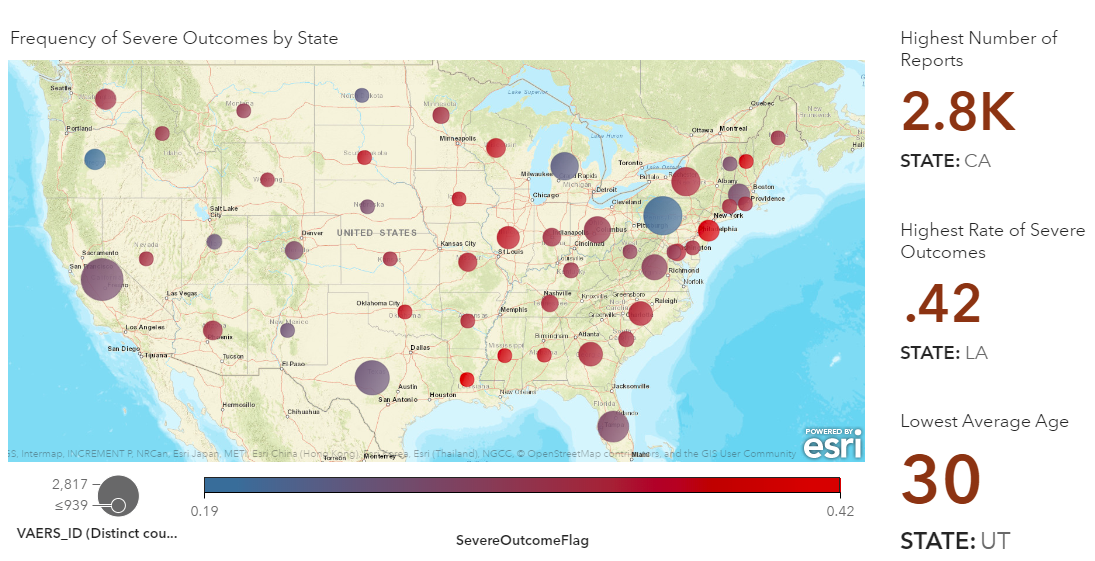
* Identify potential patient risk factors, including temporal, demographic, or geographic reporting clusters
Below is a view of the raw data. It contains a text field which holds freeform case notes, along with structured fields which contain the patient’s location, age, sex, date, vaccination details, and flags for serious outcomes such as hospitalization or death.
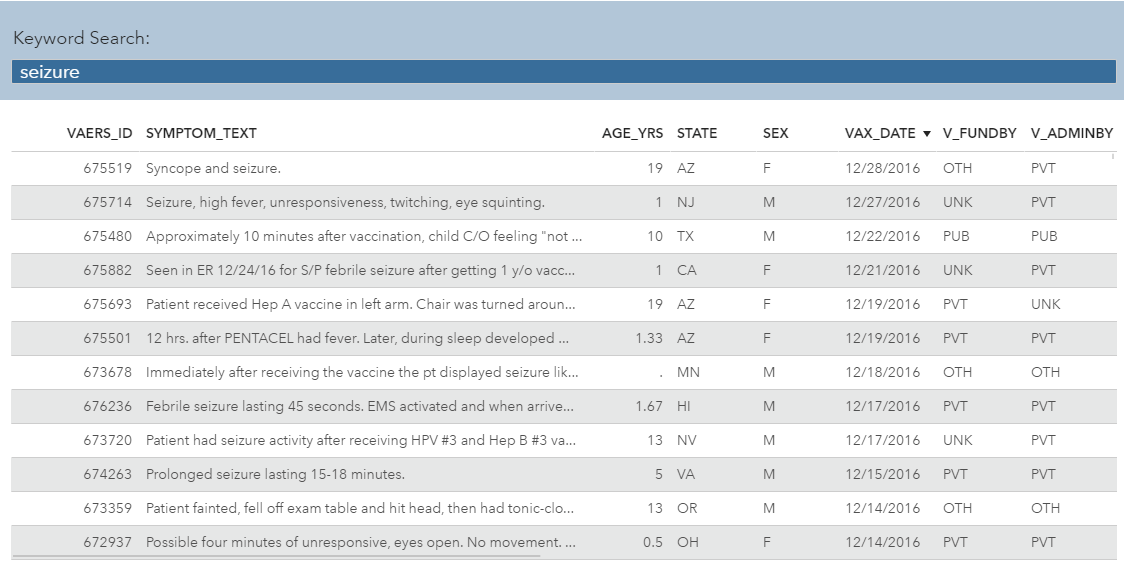
In this dashboard, notice how we easily can do a search for a keyword “seizure” to filter to patients who have reported this symptom in the comments. However, analysts need much more than just Search. They need to be able to not only investigate all the symptoms an individual patient is experiencing, but also see what patterns are emerging in aggregate so they can detect systemic safety or process issues. To do this, we need to harvest the insights from the freeform text field, and for that we’ll use SAS Visual Text Analytics.
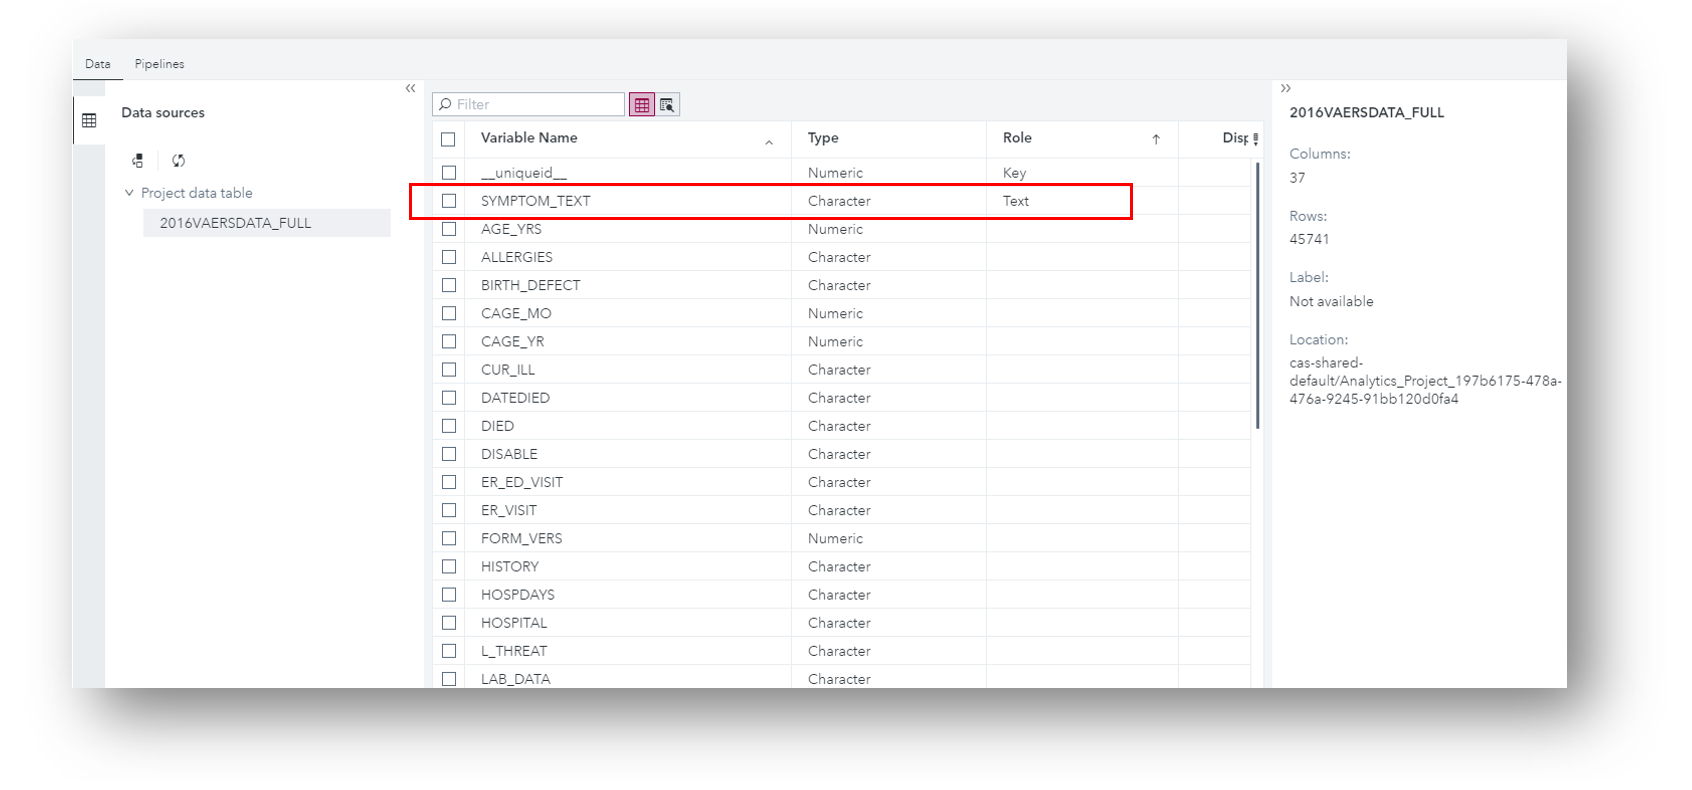
In this solution, we can do many types of text analysis – which you choose depends on the nature of the data and your goals. When we load the data into the solution, it first displays all the variables in the table and detects their types. We could profile the structured fields further to see summary statistics and determine if any data cleansing is appropriate, but for now let’s just build a quick text model for the SYMPTOM_TEXT variable.
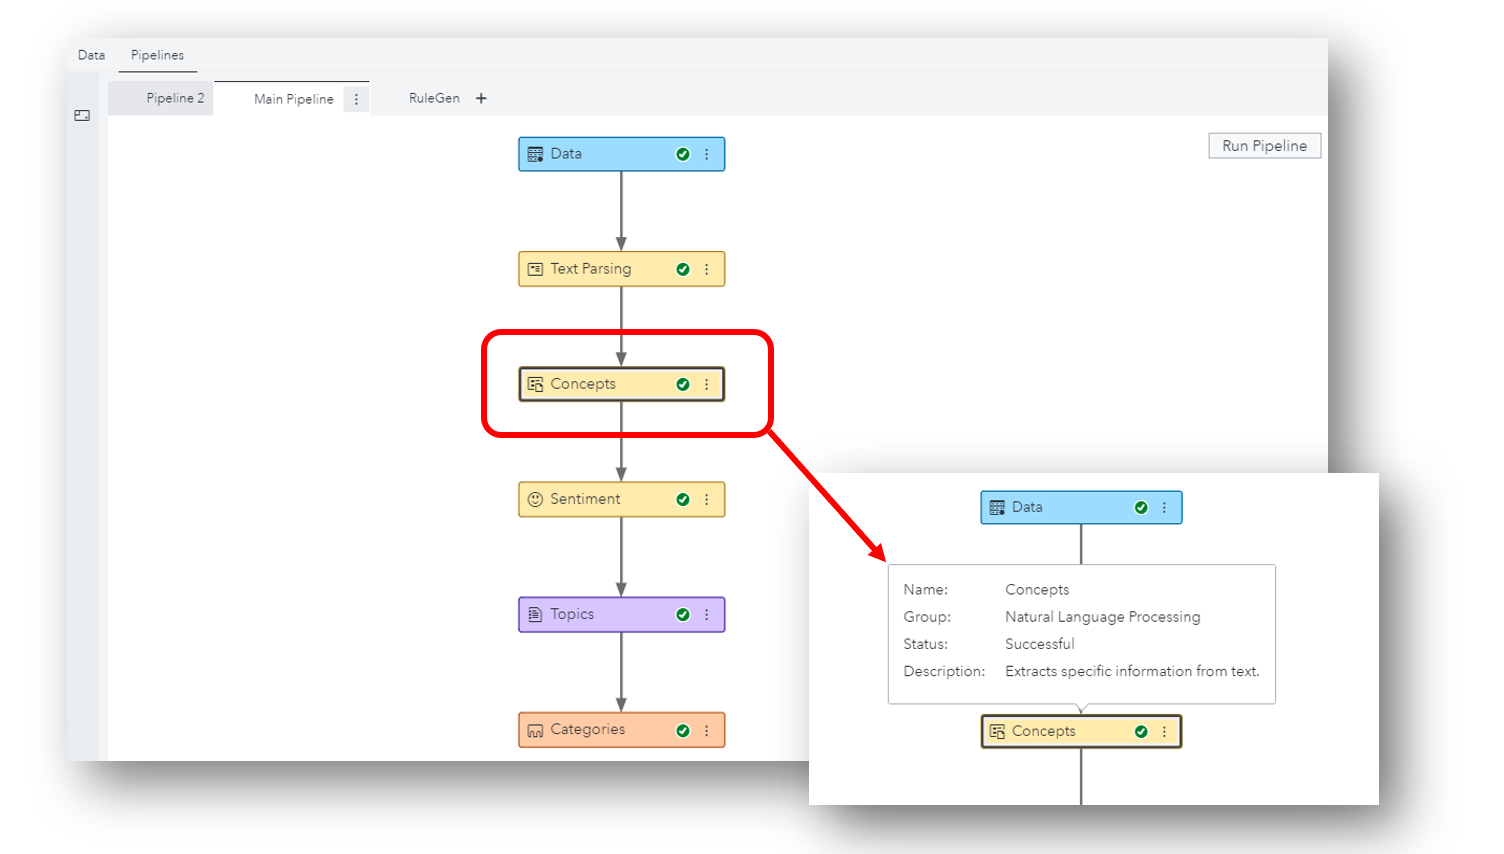
After assigning this variable to the “Text” role, SAS Visual Text Analytics automatically builds a pipeline which we can use to string together analytic tasks. In this default pipeline, first we parse the data and identify key entities, and then the solution assigns a sentiment label to each document, discovers topics (i.e. themes) of interest, and categorizes the collection in a meaningful way. Each of these nodes is interactive.
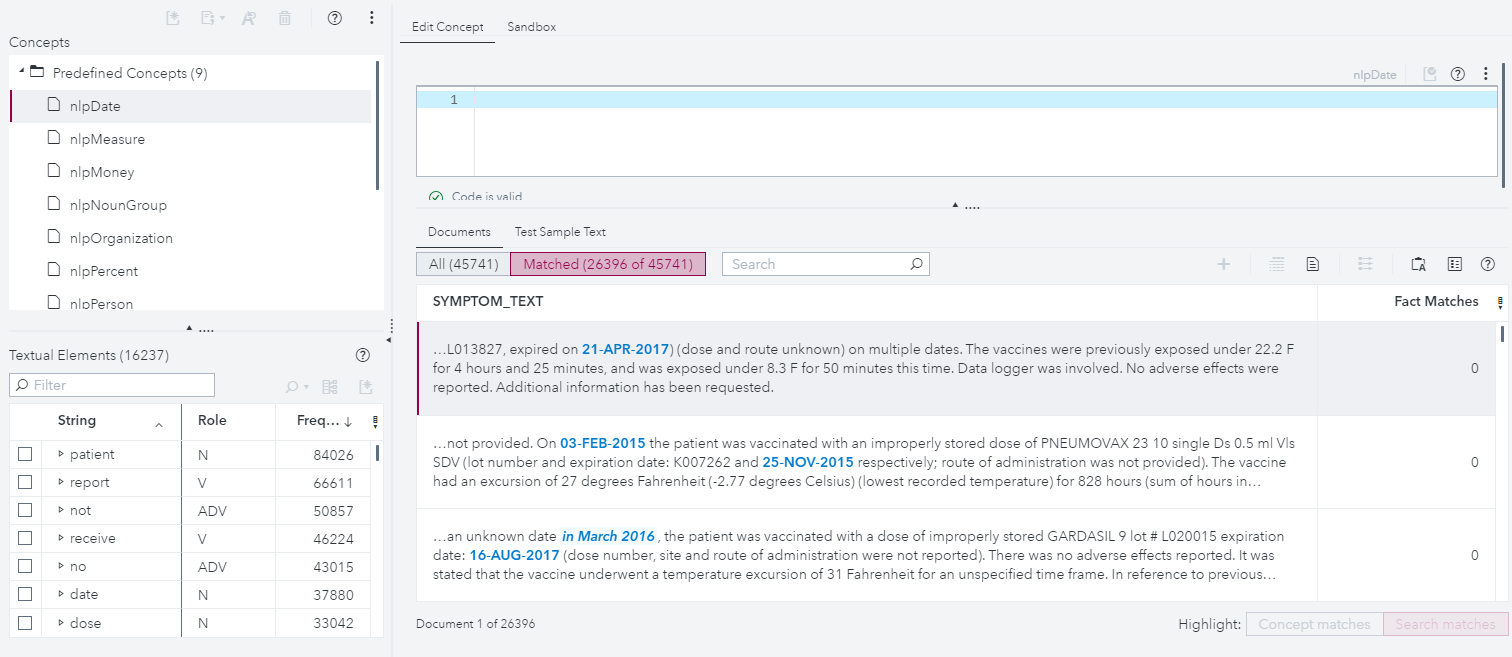
In this post, we’ll show just a tiny piece of overall functionality – how to automatically extract custom entities and relationships using a combination of machine learning and linguistic rules. In the Concepts node, we provide several standard entities to use out of the box. For example, here are the automatic matches to the pre-defined “DATE” concept:
However, for this data, we’re interested in extracting something different – patient symptoms, and where on the body they occurred. Since neither open source Named Entity Recognition (NER) models nor SAS Pre-defined Concepts will do something as domain-specific as this out of the box, it’s up to us to define what we mean by a symptom or a body part under Custom Concepts.
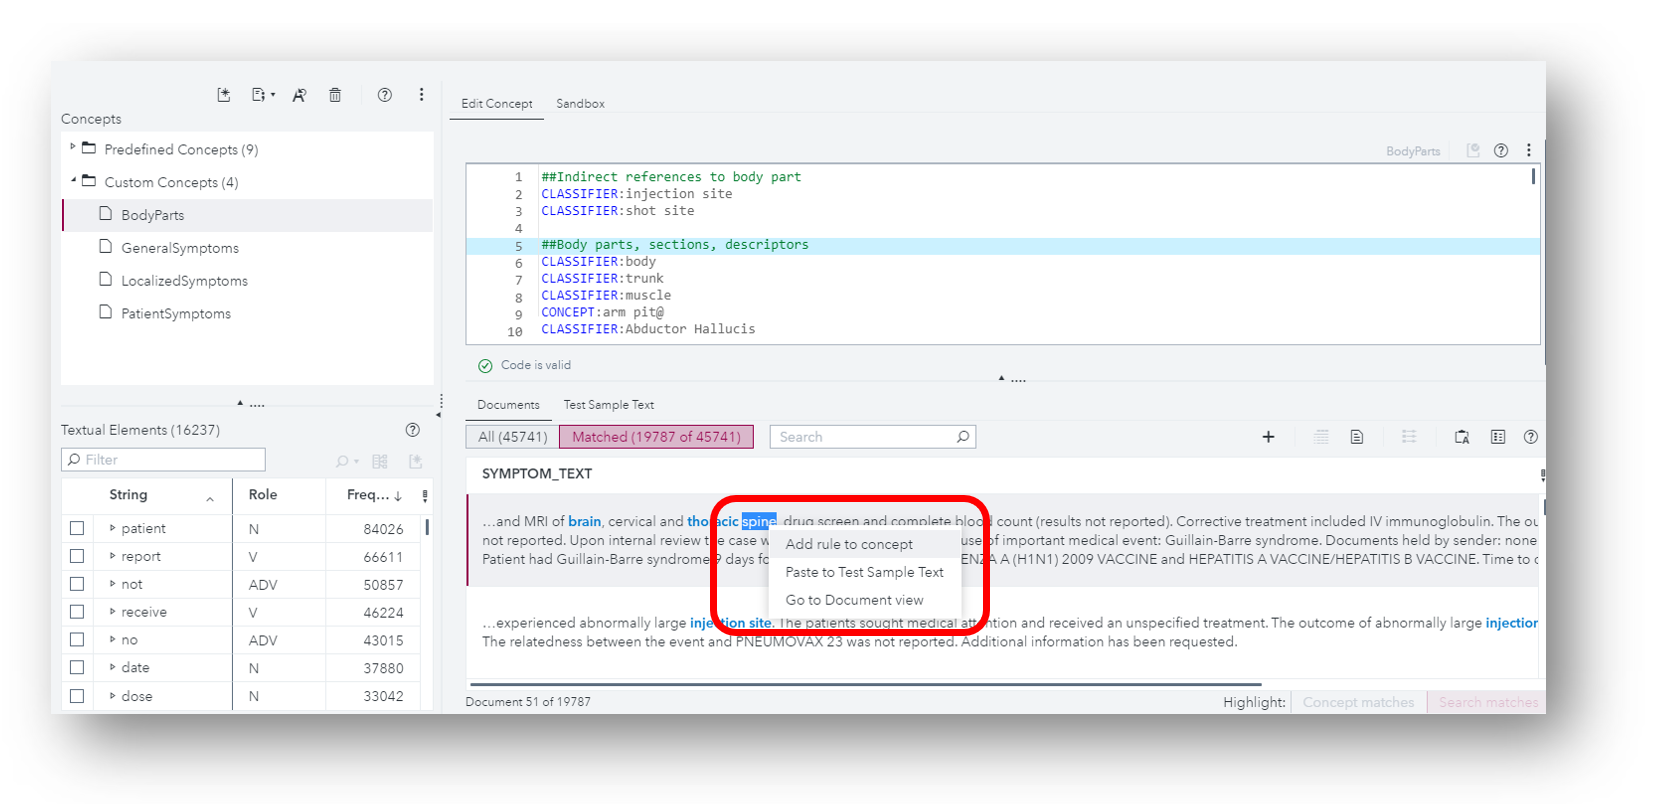
For Body Parts, we started with a list of expected parts from medical dictionaries and subject matter experts. As I iterate through and inspect the results, I might see a keyword or phrase that I missed. In the upcoming version of SAS Visual Text Analytics, I will be able to simply highlight it and right click to add it to the rule set.
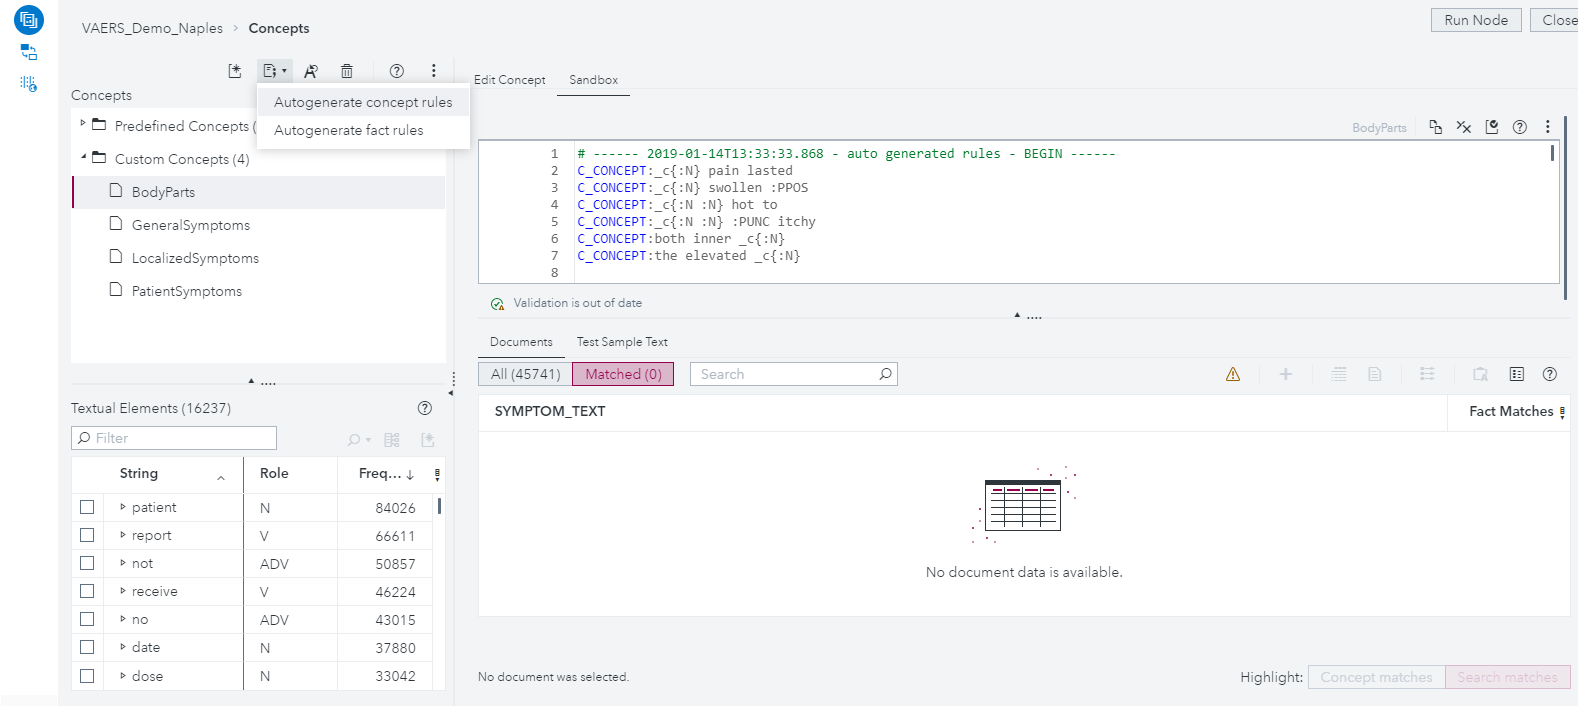
We also will be adding a powerful new feature that applies machine learning to suggest additional rules for us. Note that this isn’t a simple thesaurus lookup! Instead, an algorithm is using the matches you’ve already told it are good, combined with the data itself, to learn the pattern you’re interested in. The suggested rules are placed in a new Sandbox area where you can test and evaluate them before adding them to your final definition.
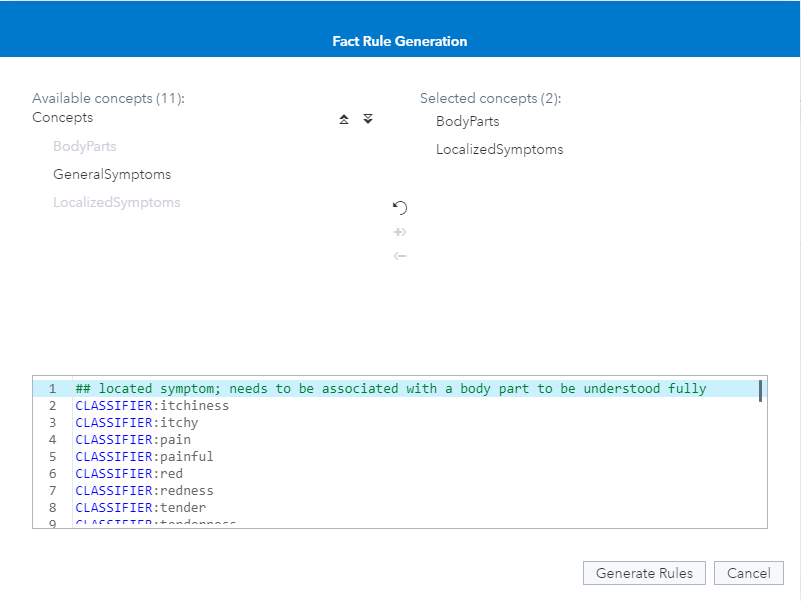
We will also be able to auto-generate fact rules. This will help us pull out meaningful relationships between two entities and suggest a generalized pattern for modeling it. Here, we’ll have the machine determine the best relationship between Body Parts and Localized Symptoms, so that we can answer questions like, “where does it hurt?”, or “what body part was red (or itchy or swollen or tingly, etc.)?”. For this data, the tool suggested a rule which looks for a body part within 6 terms of a symptom, regardless of order, so long as both are contained in the same sentence.
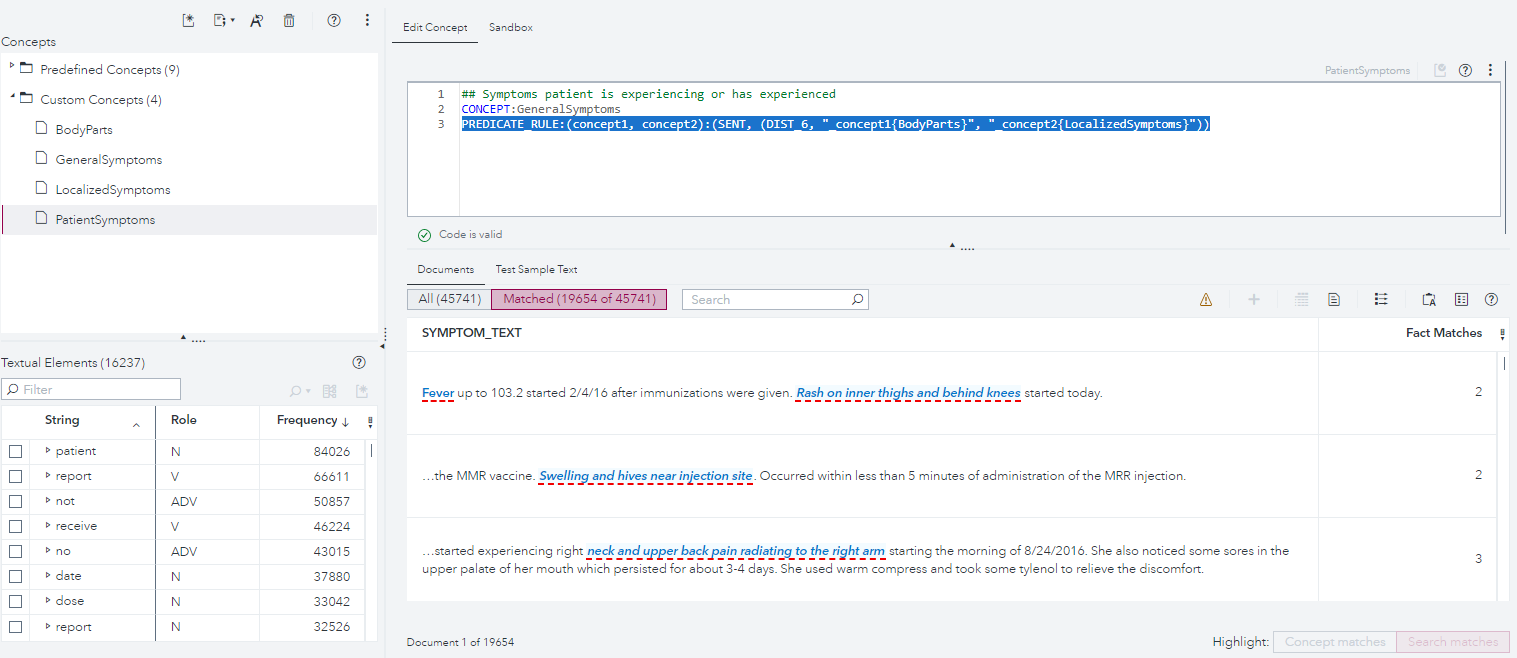
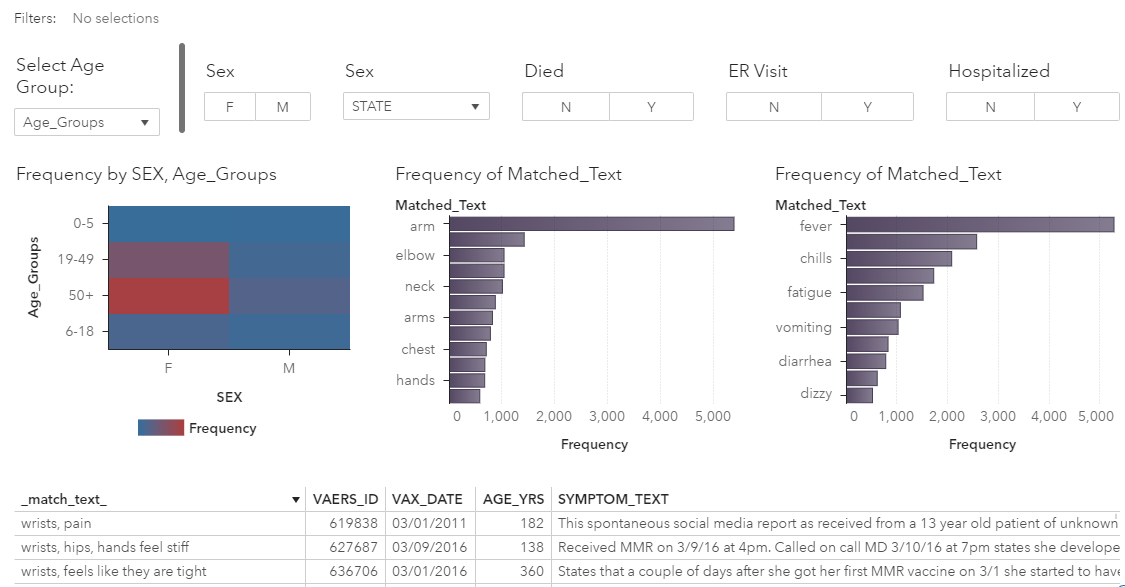
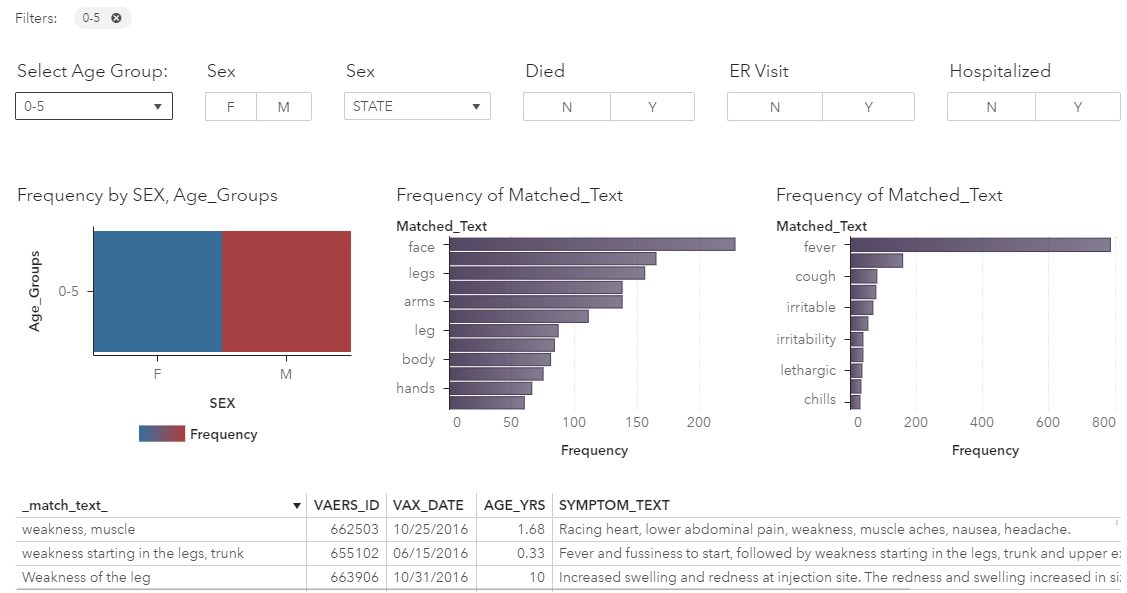
Let’s apply just these few simple rules to our entire dataset and go back to the dashboard view. If we look at the results, we can see now much richer potential for finding insights the data. I can easily select a single patient and see an entire list of his/her side effects alongside key details about the vaccination. I can also compare the most commonly reported symptoms by age group, gender, or geography, or which body parts and symptoms may be predictors of a severe outcome like hospitalization or death.
Of course, there is much more we could do with this data. We could extract the name of the vaccine that was administered, the time to symptom onset, duration period of the symptoms, and other important information. However, even this simple example illustrates the technique and power of contextual extraction, and how it can enhance our ability to analyze large collections of complex data. Currently, concept rule generation is on the forefront of our research efforts in its experimental first stages. This, along with the sandbox testing environment, will make it even faster and easier for analysts to do this work in SAS Visual Text Analytics. Here are a few other resources to check out if you want to dig in further.
Article: Reduce the cost-barrier of generating labeled text data for machine learning algorithms

2 Comments
Sure is, Jerry. Here's a link to the SAS Visual Text Analytics Free Trial: https://www.sas.com/en_us/trials/software/visual-text-analytics/form.html
Interesting post. Is there any free version of SAS Visual Text Analytics to try?