In SAS Visual Analytics 8.2 on SAS Viya 3.3, there are a number of new data features available. Some of these features are completely new, and some are features from the 7.x release that had not yet been included in the 8.1 release. I’ll cover a few of these new features in this post.
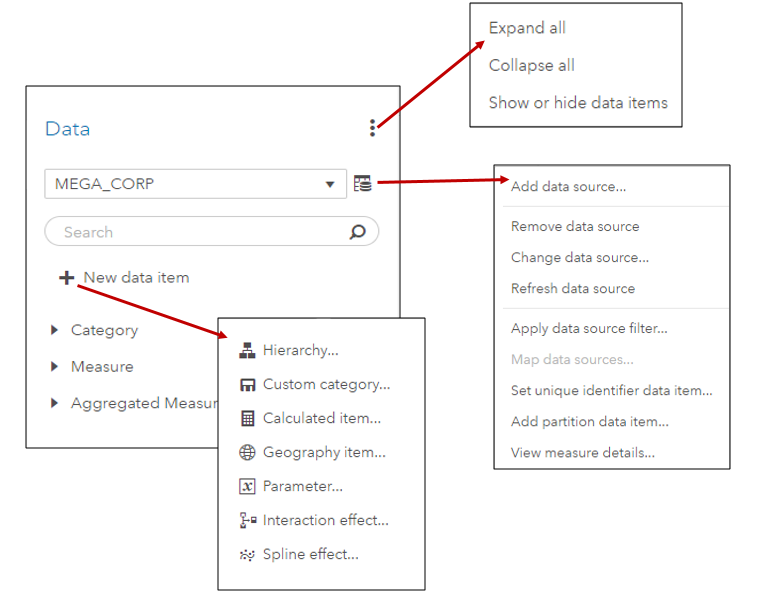
First of all, the Data pane interface has changed to enable users to access actions via fewer and better organized menus.
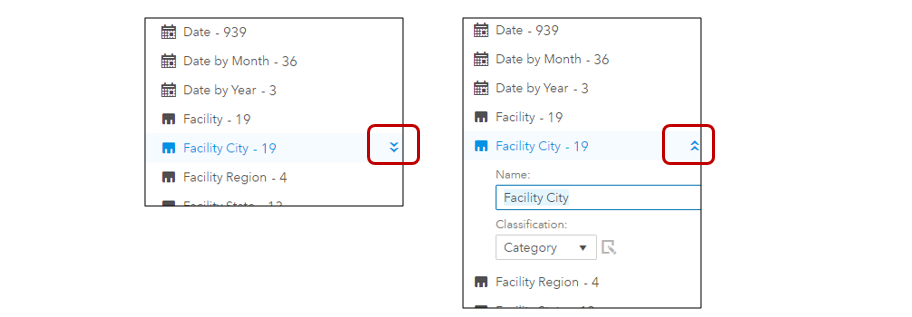
Data item properties can also be displayed for viewing or editing with a single click.
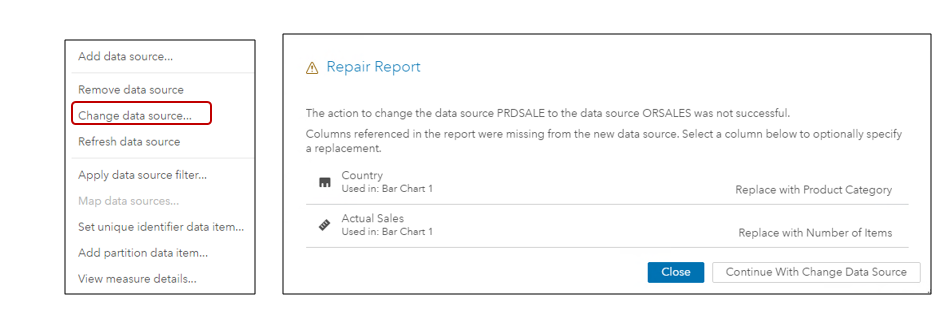
The new Change data source action displays a Repair report window if report data items are not in the new data source. The window enables you to replace the missing data items with replacement data items from the new data source before continuing with the change.
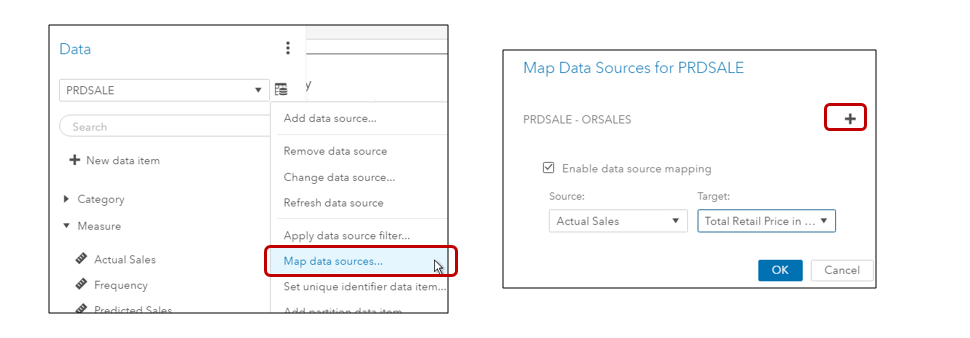
Speaking of mapping, in SAS Visual Analytics 8.2, linked selections and filters can automatically be add to objects, and the objects may use different data sources. In that case, you can manually map data sources from the data pane. The + icon enables you to add additional pairs of mappings.
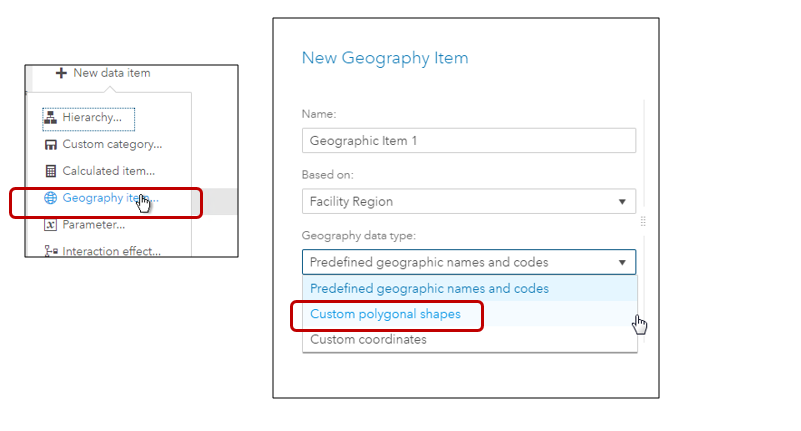
When you create a new Geography data item in SAS Visual Analytics 8.2, in addition to using Predefined names and codes or your own custom latitude and longitude data items, you can now also use custom polygon shapes to display your own custom regions. Once you select Custom polygon shapes, you specify, in additional dialogs, the characteristics of your polygon provider. You can use a CAS table or an Esri Feature Service.
For more information on custom polygons, see my previous blog here.
If you need to use and Esri shape file for your polygon data, there are macros available in VA 8.2 to convert the data to a SAS dataset and to load the data into CAS.
- %SHPCNTNT display the contents of the shape file
- %SHPIMPRT converts the shapefile into a SAS dataset and loads it into CAS.
Documentation for the macros is here.
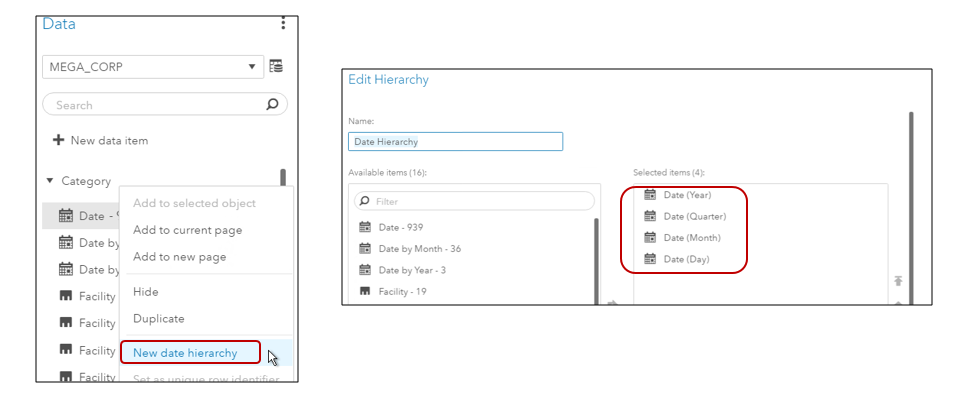
The great feature for easy, automatic creation of date hierarchies is back in SAS Visual Analytics 8.2. Just select New data hierarchy, name the hierarchy, and you are automatically presented with your date data items to select and order for the new hierarchy.
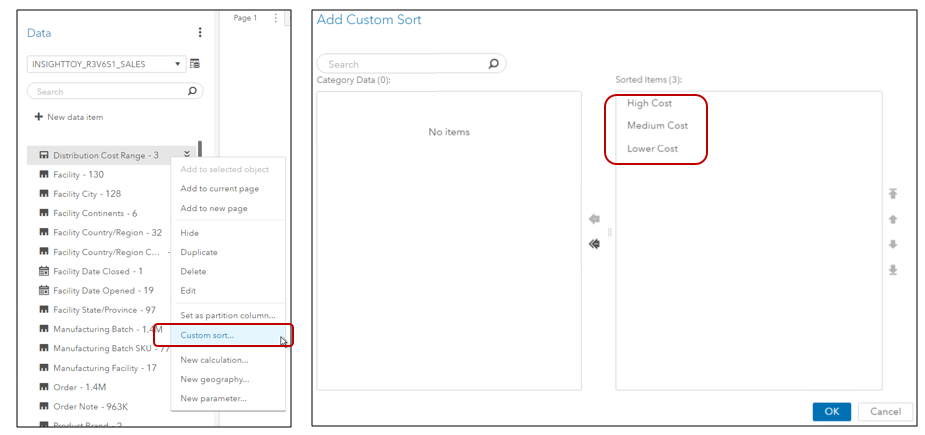
The Custom Sort feature is also back in SAS Visual Analytics 8.2. Just right-click the data item, select Custom sort, and then select and order your data values.
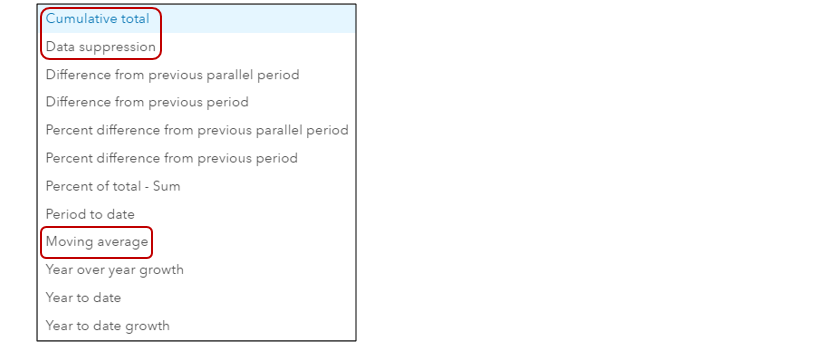
For creating a new derived data item, there are several new calculations available for measures:
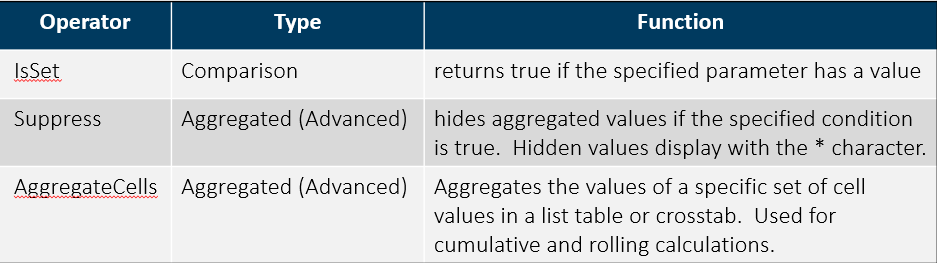
And speaking of creating calculated data items, you’ll want to check out three useful new operators that are available in SAS Visual Analytics 8.2: