Another report requirement came my way and I wanted to share how to use our Visual Analytics’ out-of-the-box relative period calculations to solve it.
Essentially, we had a customer who wanted to see a metric for every month, the previous month’s value next to it, and lastly the difference between the two.
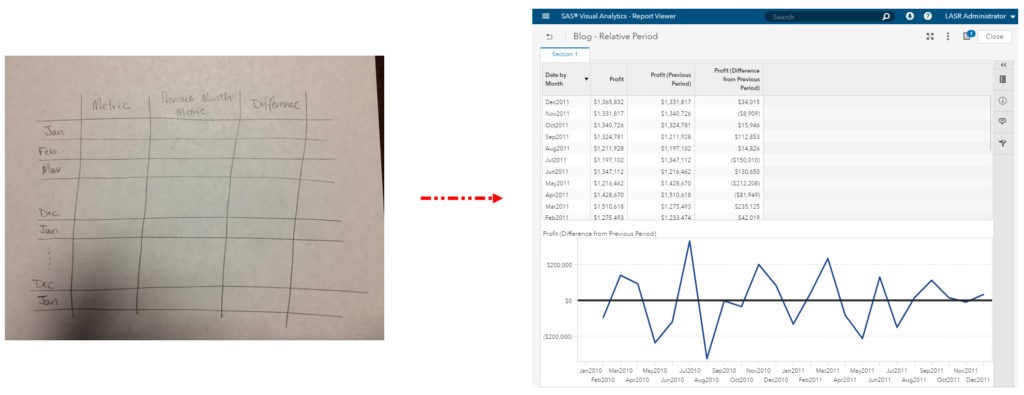
To do this in SAS Visual Analytics, which is available in versions 7.3 and above, use the relative periodic operators. I am going to use the Mega_Corp data which has a date data item called Date by Month using the format: MMMYYYY. SAS Visual Analytics supports relative period calculations for month, quarter and year.
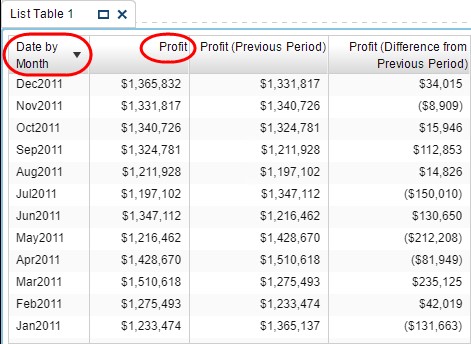
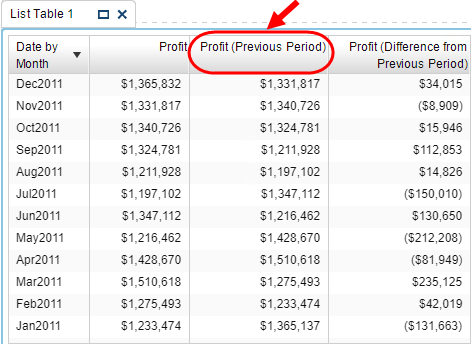
The first two columns, circled in red, are straight from the data. The metric we are interested in for this report is Profit.
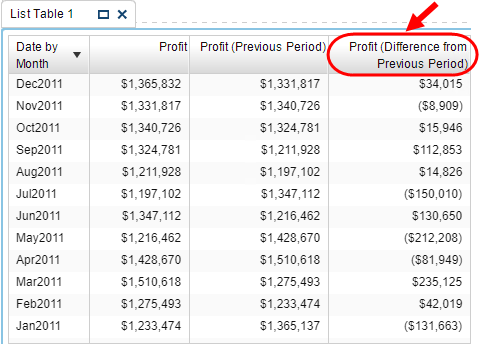
Next, we will create the last column, Profit (Difference from Previous Period), which is an aggregated measure that uses the periodic operators.
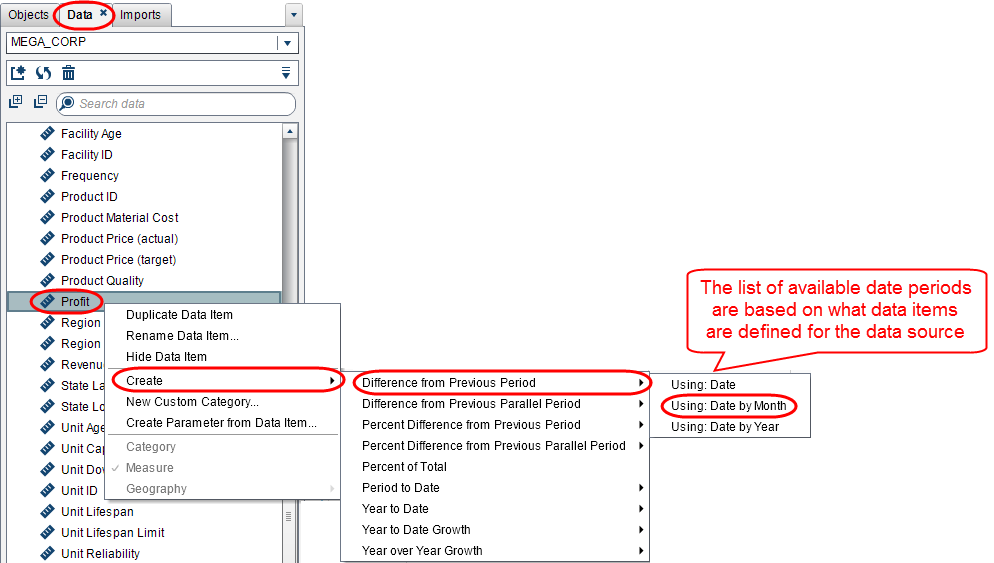
From the Data pane, select the metric used in the list table, Profit. Then right-click on Profit and navigate the menus: Create / Difference from Previous Period / Using: Date by Month.
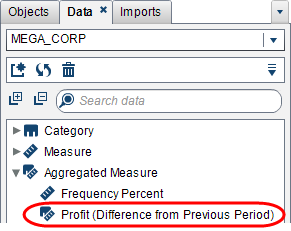
A new aggregated measure will be created for you:
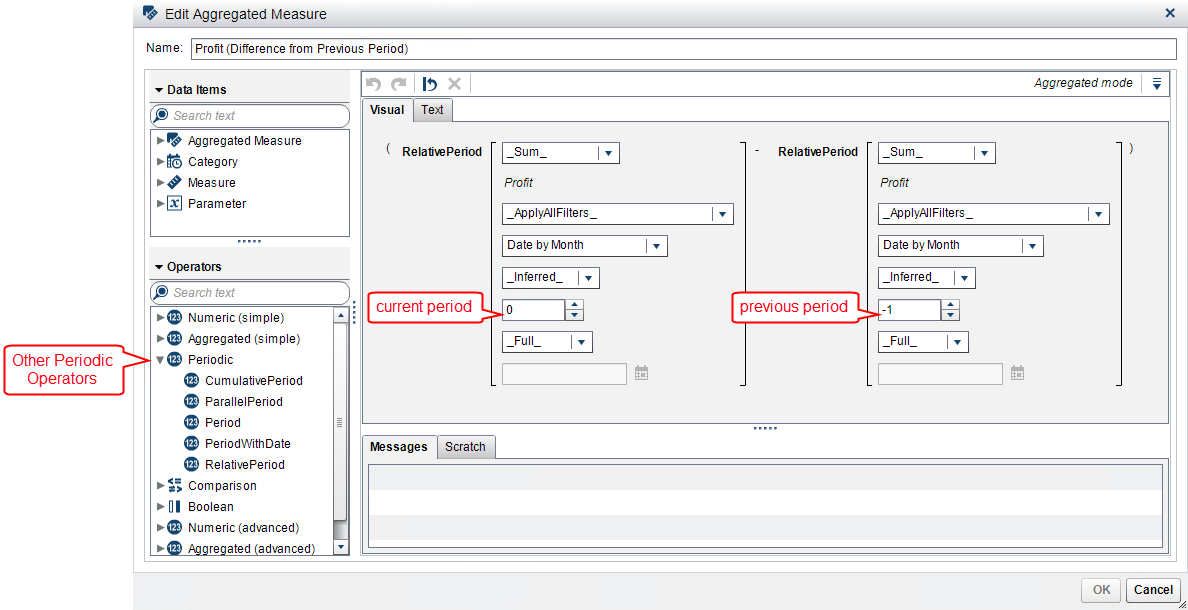
If you right-click on the aggregated measure and select Edit Aggregated Measure…, you will see this relative period calculation, where it is taking the current period (notice the 0) minus the value for the previous period (notice the -1).
Okay – that’s it. This out-of-the-box relative period calculation is ready to be added to the list table. Notice the other Period Operators available in the list. These support SAS Visual Analytics’ additional out-of-the-box aggregated measure calculations such as the Difference between Parallel Periods, Year to Date cumulative calculations, etc.
Now we have to create the final column to meet our report requirement: the Previous Period column.
To do this we are going to leverage the out-of-the-box functionality of the relative period calculation. Since this aggregated measure calculates the previous period for the subtraction – let’s use this to our advantage.
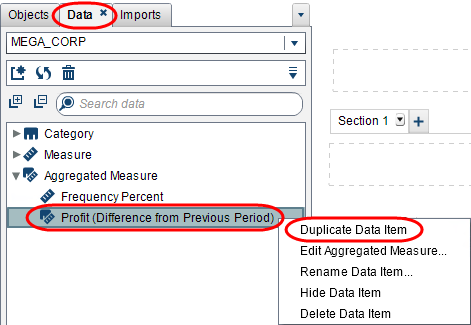
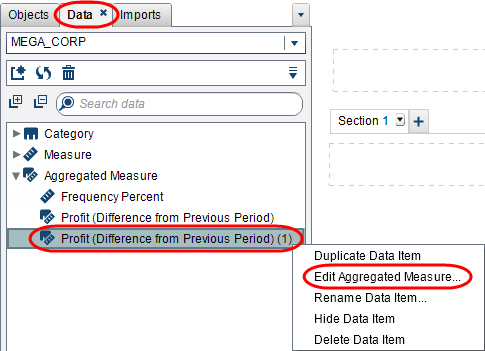
Duplicate the out-of-the-box relative period calculation by right-clicking on Profit (Difference from Previous Period) and select Duplicate Data Item.
Then right-click on the new data item, and select Edit Aggregated Measure….
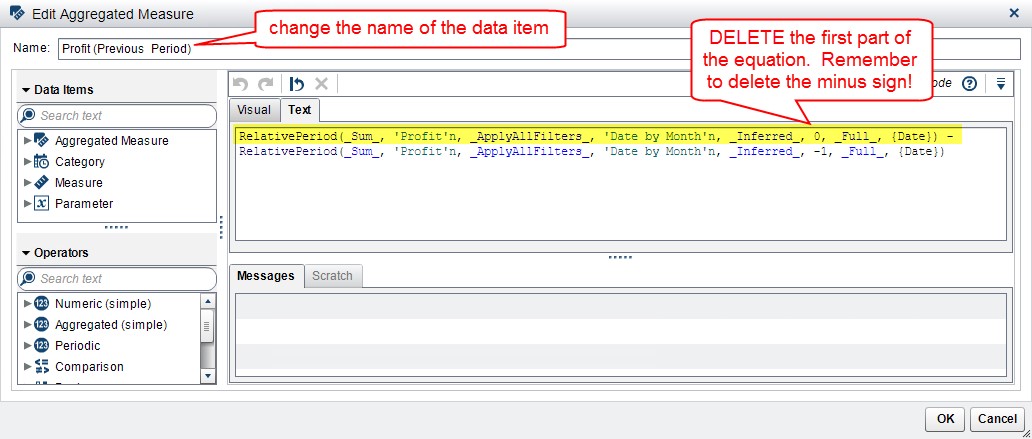
Now delete everything highlighted in yellow below, remember to also delete the minus sign. And give the data item a new name. Click OK. This will create an aggregated measure that will calculate the previous period.
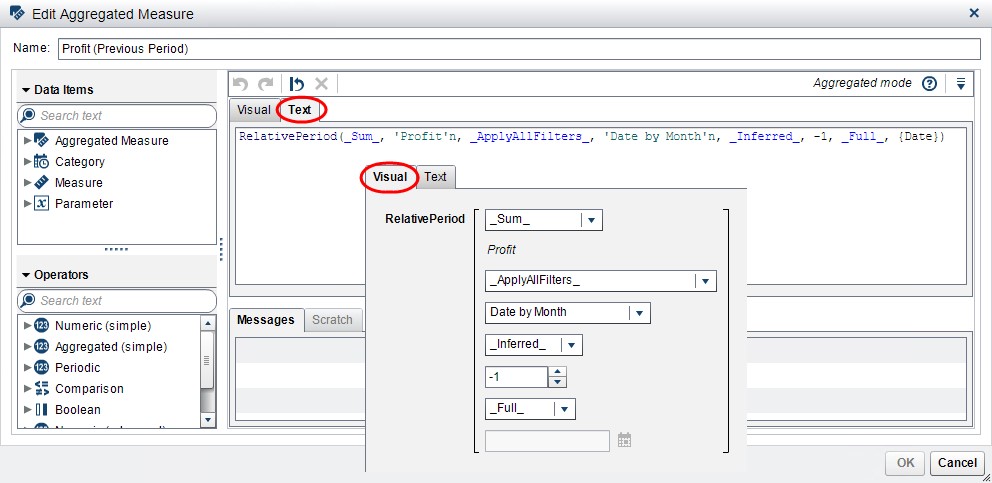
The final result should look like this from either the Visual tab or Text tab:
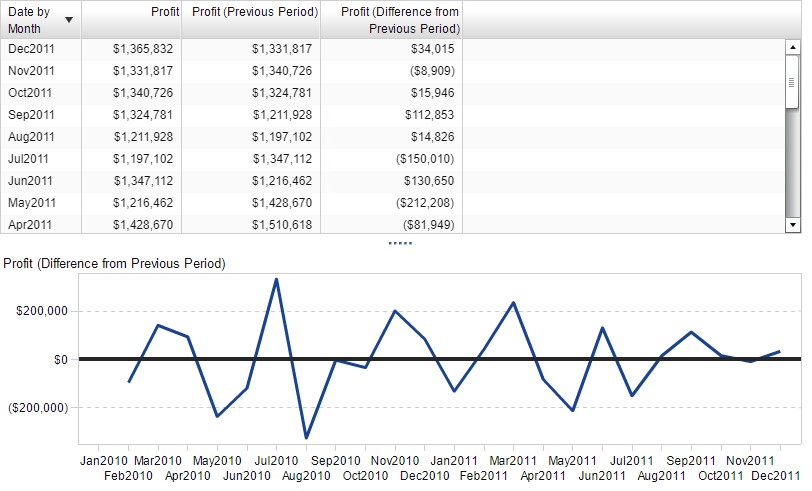
Now we have all the columns to meet our report requirement:
Now that I’ve piqued your interest, I’m sure you are wondering if you could use this technique to create aggregated data items to represent the Period -1, -2, -3 offset? YES! This is absolutely possible.
Also, I went ahead and plotted the Difference from Previous Period on a line chart. This is an extremely useful visualization to gage if the variance between periods is acceptable. You can easily assign display rules to this visualization to flag any periods that may need further investigation.

4 Comments
Hello ! Thanks for this clear article. Unfortunately I have a strange behaviour : the relative function works for me but only of the previous data (date) is shown in my table/graph. Why is a no-sense.
I'll try to be as clear as possible : To be able to use the "relative period" function, you will agree that you need the data of the previous period right, in addition to the current one ?
Which means for example a montly value for 2017 and 2018 :
The point is, when I create a relative period function, I don't want the 2017 date to be displayed in my graph or table, only the 2018 with NEXT to it, the relative n-1 field, which is what you explained perfectly and showed in your screenshots .
So either I have 2017 data + 2018 AND relative n-1 fields showing up, OR, if I filter my table/graph to have only 2018 data, then the relative n-1 fields will be empty !
Really strange...
Did I miss something?
I'm using VA 7.4
Hi Victor,
I think I understand what you are running into. Take a look at this blog here - I think once you adjust this property on your calculation you should be able to get your values for 2018 without showing 2017.
Thank you,
Teri
HI Teri:
This is awesome but I just couldn't quite get it to work (on the instance of VA 7.3 I am running) when adding a filter for month. When using a filter the numbers just didn't seem to be working right and in reviewing the calculation of the 'Aggregated Measures' there was no drop box for _applyAllFilters_, and I tried to manually write in the _applyAllFilters_ into the formula in the textbox the message box threw a bunch of errors related to changing to text etc.
Hi Kevin,
Thanks for your interest. When you add the filter for Month – depending on what you are filtering out – you may be altering the available previous period underlying data. The _applyAllFilter_ parameter you see in my screenshots were introduced with the VA 7.4 release and it instructs the aggregated measure whether or not to ignore incoming date/datetime filters. In VA 7.3 you will not be able to add this as a parameter to the aggregated measure.
I’ll email you so you can send me a screenshot of what you are trying to achieve in your report and perhaps we can find a workaround.
Thank you,
Teri