 Analysts often use a simple moving average to get an idea of the trends in data. This is simply an average of a subset of time periods, and the size of the subset can differ depending on the application. The technique can be used with data based on time periods, such as sales data, expense data, telecom data, or stock market data. The average is called ‘moving’ because it is continually recomputed as more data becomes available. This type of average is also called a ‘rolling average’ or ‘running average’. In this post, I’ll share a little bit about how to use the periodic operators in SAS Visual Analytics Designer to calculate a simple moving average.
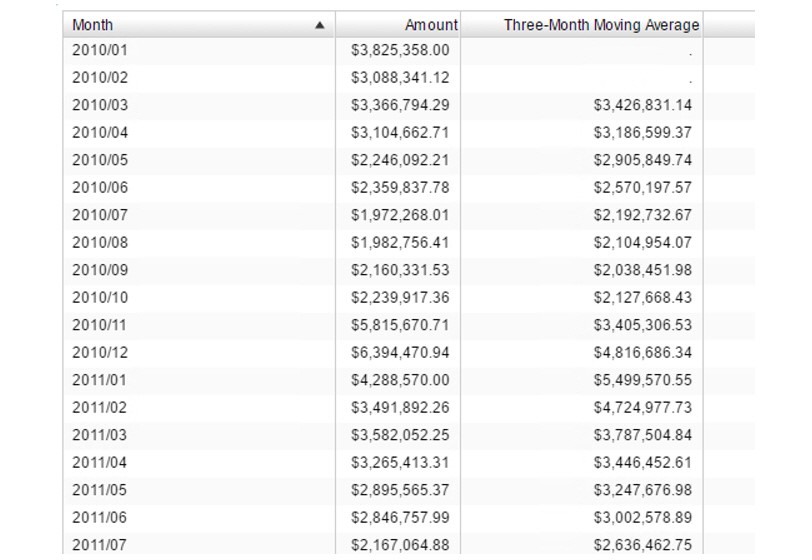
The report below, created in the designer, shows the summary of the Amount column by month. The Three-Month Moving Average column displays the average of a month and the previous two months’ Amount sums. The 3-month sum is simply divided by 3.
This Three-Month Moving Average column is an aggregation, calculated using the RelativePeriod Periodic operator. Both the visual and the text forms of the aggregation are shown below:
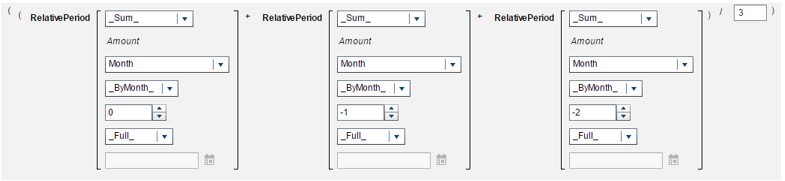
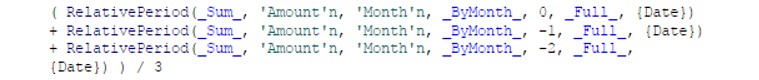
The RelativePeriod operator returns aggregated values - sum of Amount, in this case - relative to the current period – in this case, the previous month. The data item for the period calculation is Month, which is a date value with an associated YYYYMM format. The interval is _ByMonth_, and the 0, -1, and -2 offset values represent the current month, the previous month, and the month before the previous, respectively. The division by three creates the 3-month moving average, but the number of RelativePeriod expressions and the divisor could be adjusted to calculate an average based on any number of months.
The report below displays a 3-Year Moving Average column.
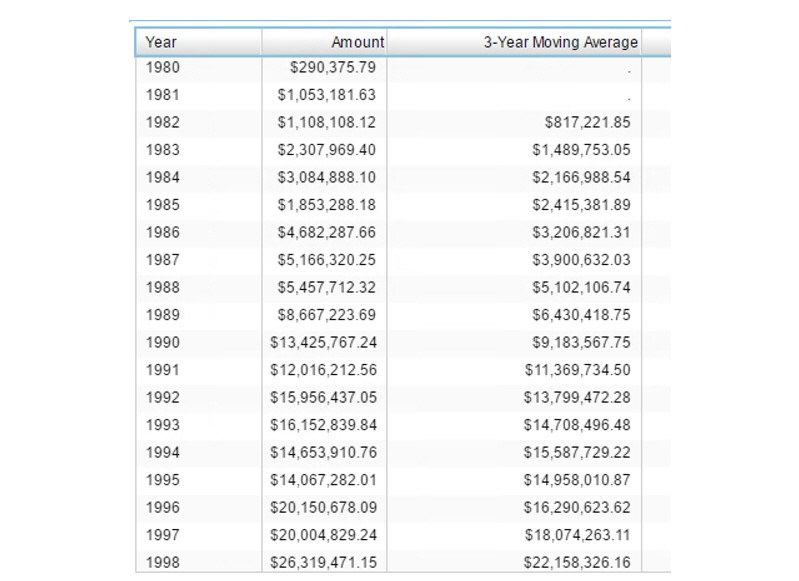
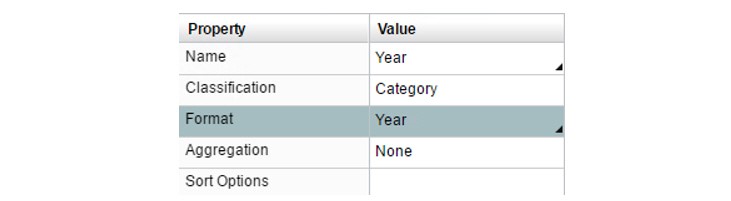
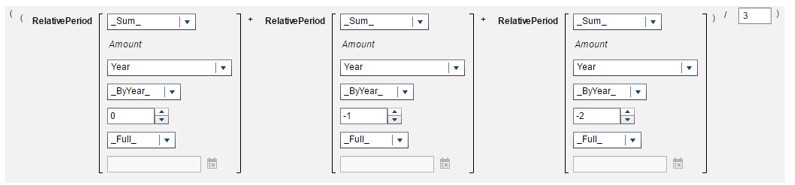
In this report, the RelativePeriod operator is used to calculate the three-year moving average. The data item for the period calculation is Year, which is a date value with an associated Year format.
The interval is _ByYear_, with the 0, -1, and -2 offset values representing the current year, the previous year, and the year before the previous, respectively. Again, the number of RelativePeriod expressions and the divisor could be adjusted to calculate an average based on any number of years.

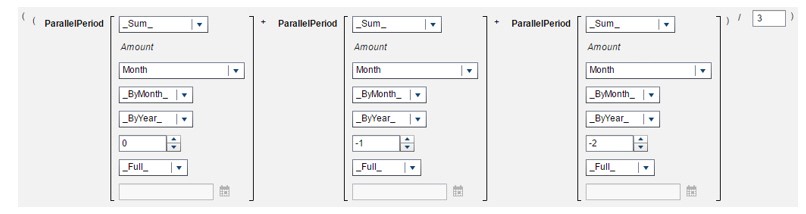
The ParallelPeriod operator is used in the report below to display a 3-month moving average based on amounts corresponding to the same month in each of the three years. This report, of course, has missing values for all months up until the third year of data.
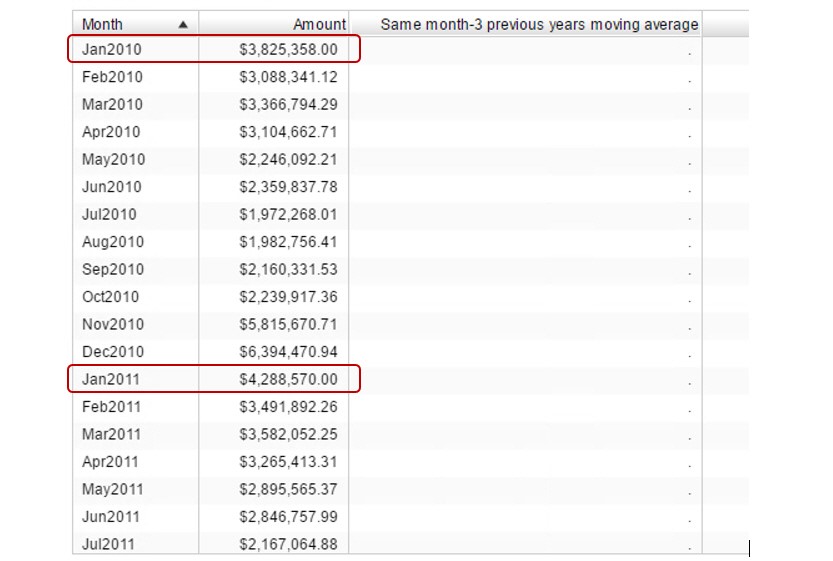
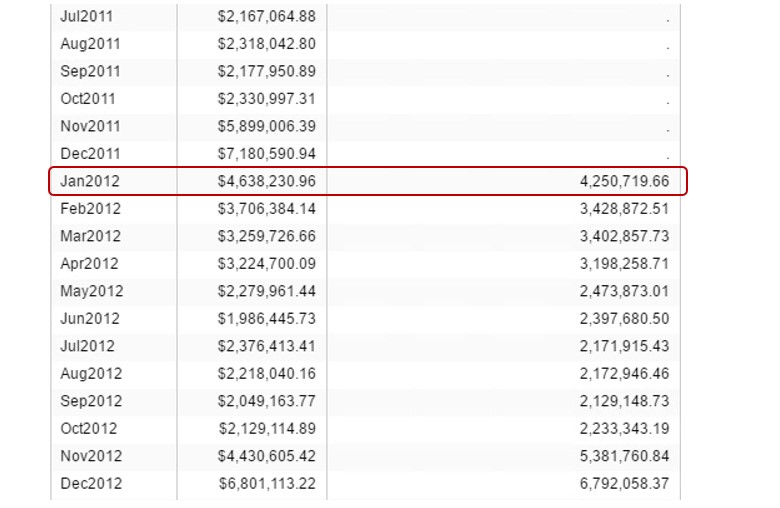
The first moving average value to be calculated is based on data from January 2010, 2011, and 2012. The measure is Amount and the periodic item for the aggregation Month. The inner interval for the aggregation is _ByMonth_ and the outer interval is _ByYear_. The 0, -1, and -2 offset values represent months of the current year, the previous year, and the year before the previous, respectively. These ParallelPeriod expressions and the divisor could also be adjusted to calculate an average based a different divisor.

Do keep in mind that for all of these periodic aggregations the ‘aggregation by’ column representing month or year must be included in the report.
I hope these examples using the periodic operators will be helpful to you in creating your Visual Analytics reports.

1 Comment
Hi this is really useful, also I have one query on calculating static averages: such as last
6 months or first three months average. I have a date and amount and if I have to calculate the average for months from Jan to Jun , how will I do that ? The limitations that I see in
SAS VA is date column cannot be called in parameter and I cannot freeze the dates
So I want to give user either a flexibility to choose a date and then based on date it should calculate 6 months average. Or if I have cross tab then for selected year it should give me average for
6, or last 3 or previous to last three.
Help me if you have dealt with this before!!!!