In the latest release of SAS Visual Analytics Designer, a parameter is a variable whose value can be changed and that can be referenced by other report objects. Why is this an important introduction?
This addition means that, not only can you design interactive reports via prompt controls, those controls can now map to a variable that feeds the report calculated data items or aggregated measures based on numeric or string calculations. In practice, you assign a parameter to one control in your report, and then you can use that parameter multiple times in calculations, display rules, filters or ranks, and they will be automatically updated as the value of the parameter is changed.
You can also design complex reports where the same parameter can be used in multiple custom calculations, display rules, filters or ranks. Ultimately, this is the power behind parameters. A user can select a value once, whether it is a report, section prompt or even a standalone control interaction, and the parameter by-product (calculated item, aggregated measure, filter, rank or display rule) is updated in every instance within the report.
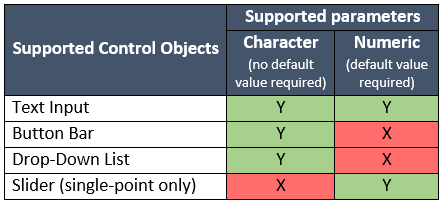
The table below lists the supported control objects and the types of supported parameters introduced in the SAS Visual Analytics 7.1 release:
Sound complicated? Not at all! Here are two step-by-step examples that show you how to create and use parameters when designing SAS Visual Analytics reports:
Example 1: slider variable and aggregated measure
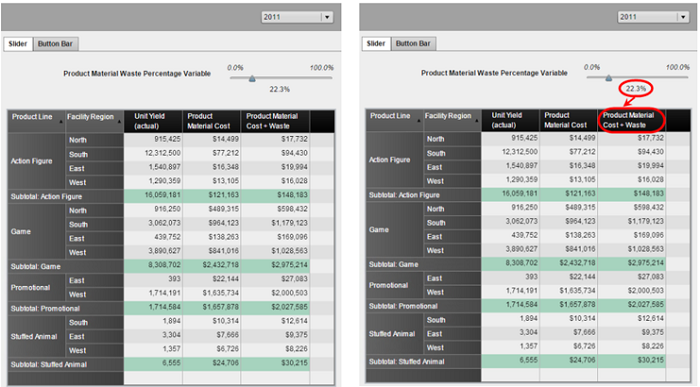
The first example shows the product material cost for product lines broken down by regions. This report allows the user to select a variable waste percentage which feeds the aggregated measure: Product Material Cost + Waste. When manufacturing products there is an excess of material, i.e. product material waste, and this report allows a user to interactively calculate the new Product Material Cost plus Waste based on a percentage variable.
Here are the steps to create this slider variable and aggregated measure example:
- Create the parameter. You can create a parameter in three places: from the Data tab’s menu, by right-clicking on the data item and from the Calculated Item or Aggregated Measure advanced editor.
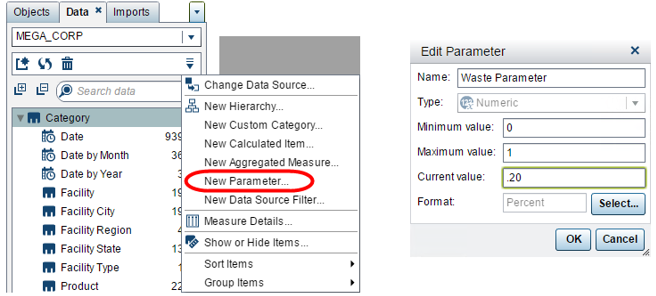
Because I wanted to add the slider control to the report first and because this parameter will not be based on an existing data item, I used the Data tab’s menu option: New Parameter…. Then you can simply name the parameter, select Numeric as the type, enter a minimum, maximum and current value, and select the desired format.
Numeric parameters require a current value, which then serves as the default value. I wanted my report users to select a 1 through 100 percent value to serve as the waste percentage variable; therefore, I used the percent format to handle the percentage display.
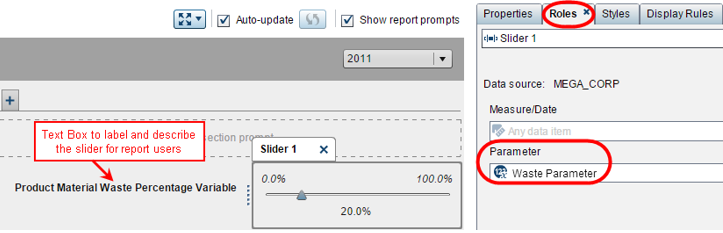
- Next, add the slider control to the report and assign the parameter role.
- Then create the aggregated measure: Product Material Cost + Waste. I used the Sum _ByGroup_ to support any combination of grouping used in the visualizations.

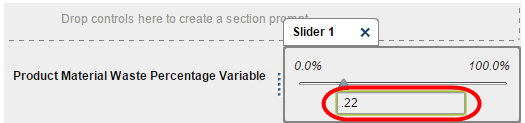
- Last, test out the parameter. The slider control supports both drag-and-drop and keyed entries. To key in a specific value, simply click on the number and enter your unformatted value.
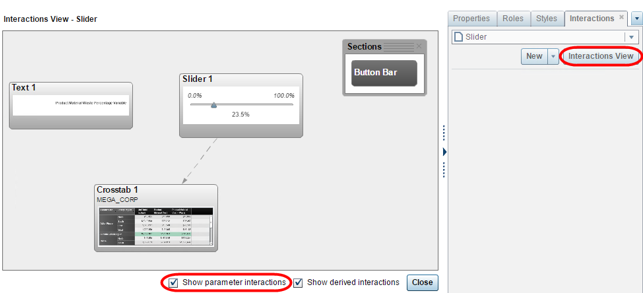
Side Note: If the control driving your parameter is not a report or section prompt, then you can see your parameter interactions from the Interactions View and selecting the Show parameter interactions check box.
Example 2: parameter driven from a button bar and custom category
The second example uses a parameter driven from a button bar using a custom category to derive an aggregated measure. I won’t walk through this example step-by-step, but here are a few pointers.
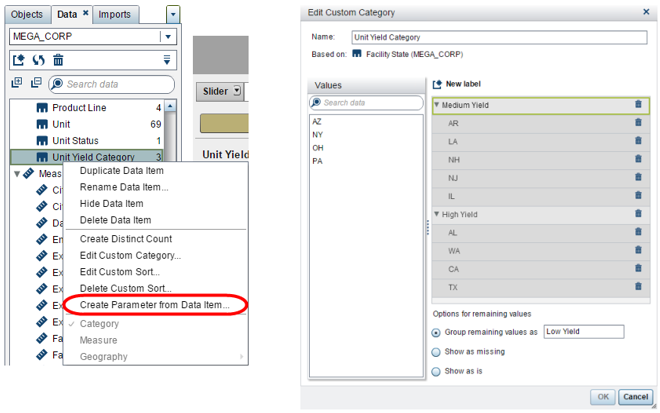
When creating a parameter that uses the data item’s values, it is easiest to right-click on the data item and select Create Parameter from Data Item…. This is even possible from custom categories, as shown in the graphic below:
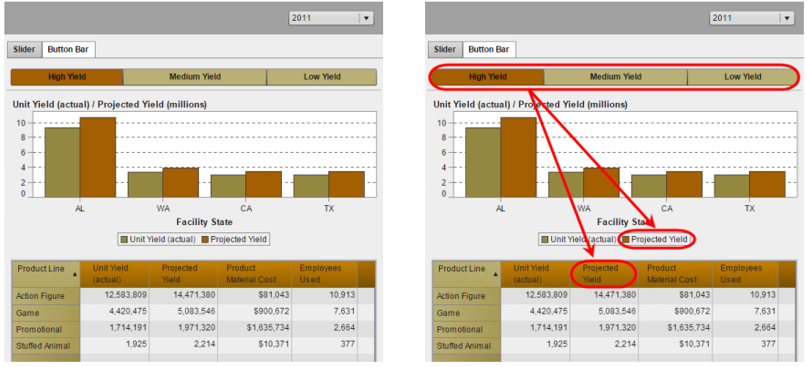
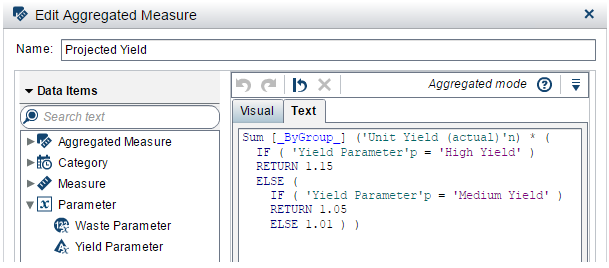
When defining the measure for this example, I used the selected value from the button bar to derive an aggregated measure based on a business rule. My business rule dictated that the Projected Yield equaled the Unit Yield (actual) multiplied by a constant. That constant was a 15% increase for High Yield states, 5% increase for Medium Yield states, and 1% increase for Low Yield states. The graphics below show how you can use either the Text view or the Visual view when defining parameters. Once defined, you can use the parameter result, in this case an aggregated measure, in multiple objects.

Example 3: complex example using web data
Watch this video tutorial for an additional example of using parameters. This example was generated using SAS to extract data from web-based sources.

34 Comments
This was very edifying, thank you for sharing!
I am in a previously created VA report and I created parameters after the fact (using Create Parameter from Data Item) and then assigned the parameter in the drop-down list that uses the category.
Note - I do NOT have a Current Value assigned to the parameter
I am trying to use the parameter in a custom URL (as described here: https://blogs.sas.com/content/sgf/2015/09/16/accessing-va-reports-with-parameterized-urls/)
The Category I am referencing is a simple, Yes/No selection and I cannot get the resulting display of the custom URL to influence the selection.
Any thoughts would be most appreciated.
Thank you,
PJ
Hi PJ,
Thanks for providing more clarification offline, it turned out that the URL needed to be properly encoded. The easiest way to get the report URL is to use the E-mail option from the File menu then tack on the parameter name and value pairs at the end.
Glad you got it working!
Thank you,
Teri
tank you. Gracias, Teri
Hi Teri,
You seem to have a pretty firm grasp on how parameters work in VA so I'm hoping you might be able to address this.
I want to pass a single piece of data (say latest date OR most popular item in the office fruit bowl this week) to Visual Analytics (Designer) and use this in calculated items for various tables and filters in various objects.
To do this by I've created a SAS table with a single row and single column (called say 'fruit' with value 'Orange') and loaded this to VA
If I create a parameter associated with the data item 'fruit' or associated with a Control Object (Drop-Down List or button Bar with the category being 'fruit') and then create calculated items/filters as required all works fine.
The problem comes if the table is repopulated with 'fruit' value 'Apple' and reloaded to VA. The parameter value does not update. I have check the 'Required' box for both of the controls and the Button Bar even shows the single possible value but it is light-gray (unselected) i.e.'Required' is not forcing selection.
The logic seems to be that the value of the data item has not been (re-)selected so the parameter is not updated.
Do you know any way to make this work as I'm intending or know any other way to address the problem.
Many thanks in advance,
Alan Whiting
Ministry of Business, Innovation and Employment
New Zealand
Hi Alan,
I think I’ve replicated your described scenario and got something working. I’ll email you directly so that I can include screenshots. But essentially I created a calculated data item to help set the value of the parameter.
Thank you,
Teri
Thanks Teri, this was helpful.
Hey Teri, I have a dashboard that uses a parameter to pass a product name to a calculated variable and the variable is used in a line chart. When user changes products the line chart changes accordingly. Works like a champ in classic view mode but we are switching to modern view and now when a new product is selected nothing happens. In designer it still works fine but not modern viewer. Any thoughts other than switch back to classic?
Thanks,
Ray
I would like to create report where to allow users to enter the text messages and that all information will automatically getting updated/inserted in the datasets. Is there any facility available in VA?
I want to know is there any possibilities to create one button and action for the button.
Hi Teri,
Is it possible to control hierarchies using parameters?? trying to group multiple categories by hierarchy by using parameters. User want to group data by mutiple categories, eg user select an object from drop down to select name and another drop down gender, the report generate crosstab using hier 1, if user wants to select age from drop down and another drop down gender then cross tab display hier2 instead of hier 1. thanks for your input
Hier1
- name
-- gender
Hier 2
- age
-- gender
Hi Teri,
I am using Time series plot where on x- axis I am using date which is in range of one quarter and on Y axis I am using some measures. On X-axis I am trying to insert reference line and I also want to update this line dynamically so that when I open report today I see reference line at today's date and when I open report tomorrow reference line should move to tomorrow's date.
Any help would be much helpful..
Hi Teri,
is there a way to create a parameter to control the bubbles on a geo bubble map and always use the max number of bubbles ? I always have to use rank to be able to avoid the "too much data" warning. Then I am entering different values on the rank until I get the max available bubbles and that is a waist of time.
Hi can we make custom aggregrated measures nased on categories ?
for example annual average salary
for men and women separate in data pane?
Hi, thanks for this information,
do u have same kind of representation for 'How do I select more than 1,000 items when filtering'
thanks
Sandeep
I want to know is there any possibilities to create one button and action for the button.
Since we can't have dynamic chart titles I was wondering if I could build such a "title" using the following logic:
The user selection from a drop-down list would be populated into a Text Input control (which is located above the chart) by using the functionality of a Parameter?
Can we use parameters created for one report in another report or in another dataset.
On Parameter video
Hi, Thanks very much for the video .It was very helpful.I tried the same using the sample_path data and instead of comments I was using 'page' as the category.
I had just 1 doubt on this, I am getting 92 as a total count of page instead of 14.
Can you please help me out on how to display the distinct count of the the page value.
Thanks,
Ashish
Hi Ashish,
Let me contact you directly so you can send me the code you are using to calculate your count metric.
Hey Teri, do we functionality in sas VA where we can auto punch all values in list which is filtering from another list , The reason is I don;t want to use right click and select all option . I am looking for some functionality which should auto punch these values.
Hi Rakesh,
Unfortunately, there is no way to create functionality for the user to click on to “select all” button for the list control object. The list control object’s default behavior is when the list initially displays and nothing is selected it is the same as “select all”. Then as you mentioned, you the right-click option.
I am new to SAS VA. I would like to have a button bar that would allow me to dynamically change the measure in my crosstab. For example if my button bar had the options "Income, Expense, Profit" I would be able to click which one to display in a crosstab. So if the default is Income by company then clicking "Expense" would update the crosstab to display Expense by company.
Hi Israel,
Let me contact you directly. I have some screenshots that I can't attach here.
Hi Teri
Could you please send the same screen shots to me. I have a similar issue where I need to swap between income generated and number of contributors.
Thanks
Hi Meagan,
I actually created a blog post outlining the solution. You can view it here: http://blogs.sas.com/content/sgf/2016/04/27/use-parameters-to-pick-your-metric-in-visual-analytics-reports/
I also wrote a post on using the stack container if you don't want to use parameters: http://blogs.sas.com/content/sgf/2016/05/25/use-a-stack-container-to-pick-your-category-in-visual-analytics-reports/
I hope these help!
Hi teri ,
I am stuck with a report req from my client.I need to compare credit rating from previous month record to the current month record value and create a flag based on this to identify all customers bettered their rating from previous month.please help
Hey Teri,
I was wondering if there is any way to have the lower end slider automatically be the 1st day of the current month? Thank you for any help that you can give me on this.
How can i assign aggregated measure (in %) to the slider filter in SAS - VA
Hi Nitesh
Unfortunately, there is no way to out-of-the-box assign the % of an aggregated measure. You would essentially have to create a new aggregated measure that returns the desired percentage and use that value in the slider role.
hi Nitesh,
Can you please share the screens shot with me.
As am I also exploring the tool this will help me in doing that
Thanks,
Anurag Rai
How to sum the aggregated measure resultant value, for example variable called "AAA" is calculated and the value is "1" and "-1" please find below table.
date AAA
12oct2015 1
13oct2015 -1
14oct2015 -1
15oct2015 -1
16oct2015 1
from the above i need to get -1 (by summing up "AAA") for all the dates, how could we do this? can any one please advise
Hi Teri,
Thanks for this wonderful blog. I was looking for a way to have parameter to capture date.
In one of the requirements my user needed a report which would allow him to select some start and end date, basis which some calculations had to be done. We had a work around done, where the MDY Function was made use of. Would you suggest any better option to create a parameter to capture user specified date.
Thanking you in advance.
Akshay,
Let me contact you directly. I have some slides that I can't attach here.
Hi Teri,
Great demo & thank you. I was looking for a resource who would show me how to use parameters in VA. This goes to my beloved topic of macro programming. I like the way you have used lite programming technique & VA to show a word counter. Looked magical. Looking forward to other posts. There is so much to do & learn in VA 7.1. I am currently learning STP for web development & VA. I think with parameters since now you can input custom text & numeric field end user can do a lot without manipulating the lasr dataset. Looking forward to your future blogs & videos.
Regards,
Pritesh