➤ DISCLOSURE!
 In this post, I am going to expand on my prior posts, Spice up SAS output with live Google maps and Live Google maps in SAS -- multiple markers to explore some new functionality.
Handpicked Related Content: The power of SAS-generated InfoWindows in Google maps
Using similar techniques, I'll demonstrate how to draw a closed geometric shape, in particular, a polygon, on a Google map. Well, let’s make it more than one polygons – two for simplicity. Overlaying polygons on a Google map is a great visualization for geographical and administrative regions, such as countries, states, counties, school districts, areas of services, etc. Besides, practically any shape can be approximated by a polygon with a large enough number of vertices. Here's an example what we are going to get:
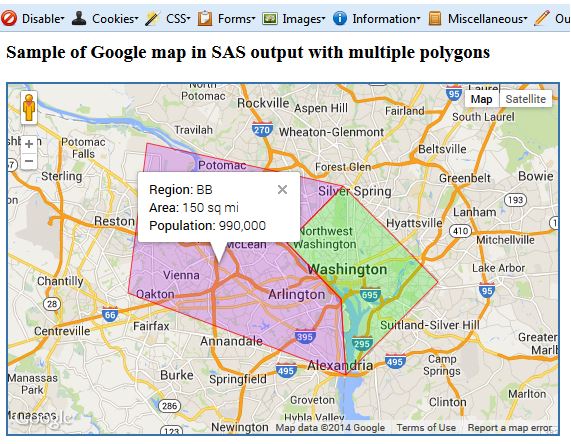
The map is rendered with semi-transparent colors as fill colors for the polygon areas and a one-pixel solid color (stroke color) for the polygon borders. Actually, border lines are not necessary if adjacent areas are of different colors.
I have also included a technique for creating an information window object that displays information pertinent to each polygon region. The code has an event listener that shows the corresponding information in the information window when a user clicks in the area of a polygon.
How it's done
You can view and download the full sample SAS code. Here are explanations and clarifications for each code section in this example:
1. Specify the HTML output file location. Use the FILENAME statement to assign a fileref to the physical location of the HTML file you are going to generate.
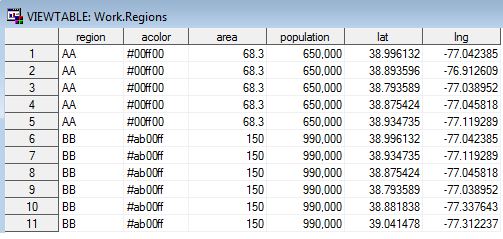
2. Prepare the data. To make this example self-contained, I generated the source SAS table within the code itself. In reality, you would prepare your data table by pulling or combining data from a database or other data storage. The source data has one observation per each vertex of each polygon. The data set variables include a region identifier (region), region color (aclor), region area in square miles (area), population, and latitude (lat) and longitude (lng) as shown here:
3. Determine the map center. Center your Google map based on the geometrical center between minimum and maximum latitudes and longitudes of all polygons’ vertices:
proc means data=regions noprint;
  var lat lng;
  output out=dataspan (keep=minlat maxlat minlng maxlng) min(lat)=minlat
        max(lat)=maxlat min(lng)=minlng max(lng)= maxlng;
run;

data centerdata;
  set dataspan;
  clat = minlat + (maxlat - minlat)/2;
  clng = minlng + (maxlng - minlng)/2;
run;
4. Initialize the map. This section is not different from our prior implementations of the Google map with markers and info windows and uses a DATA _NULL_ step to generate a non-repeatable section of the code.
5. Add multiple regions. This portion of the code also uses a DATA _NULL_ step, but here the DATA step loops through the source data as many times as there are observations in it.
First, latitude-longitude pairs of all the vertices of each polygon are written into a Javascript array (called border), and then each polygon is created and overlaid on the Google map (google.maps.Polygon({paths: border, … ).
In this code section, for each polygon (mypoly1, mypoly2), we also create contents of the info window (info1, info2) and define event listeners (google.maps.event.addListener).
6. Wrap up the HTML file. Again, this section is not different from our prior implementations of the Google map with markers and info windows and uses a DATA _NULL_ step to generate a non-repeatable section of the code to wrap up the Javascript and HTML.
Using the final Google map
Running the above code sample generatess the gmapoutput_poly.html file, which, when opened in a web browser, produces the following Google map containing two polygon areas:
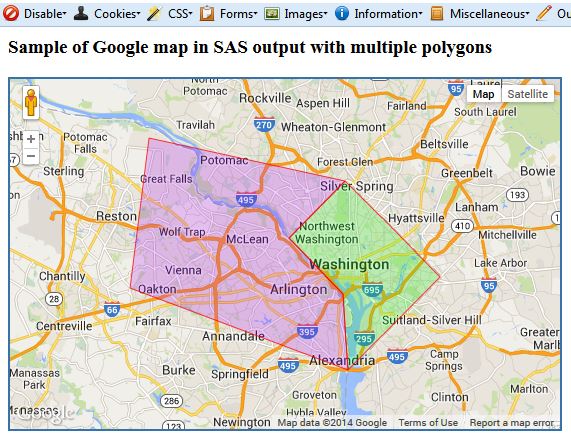
Click for an interactive version of the map. You can move it around, zoom in and zoom out, and you can click on any colored polygon to display detail information about that area in a popped information window as shown in Figure 1. The info window is opened at the point clicked by the user, but displays information about the whole polygon area. You can also switch between the Map and Satellite views.
If you are interested in Google map visualizations in SAS applications, please send me your ideas and desired functionality by commenting on this blog post.
Handpicked Related Content: The power of SAS-generated InfoWindows in Google maps

15 Comments
Is there a way of getting a static image of the above ? Also, how can I combine markers and the overlaid polygons in a single map ?
Thanks,
Bhuv, what do you mean by "a static image of the above"? You can combine polygons and markers on a single Google map. You just need to combine approach in this blog post with the one outlined in my previous post Live Google maps in SAS -- multiple markers.
Pingback: Drill, baby, drill—using SAS to drill down through Google maps - SAS Users
This is the kind of thing we’ve produced before http://www.hefce.ac.uk/whatwedo/wp/ourresearch/polar/mapofyoungparticipationareas/ using Google Fusion Tables but GFT takes too long and if you need to go back and change something then it takes hours of work to get it working again, so we thought if we could get SAS to make something like that for us then we could make everything a lot easier!
…. the automation was the most important thing, but when I saw your post on filled google maps in SAS obviously I was blown away!
I used a small file as a test for using a much bigger file (around 20,000,000 rows) and when I open the html of it, it never loads. Should I try a smaller file?
Sam, thank you for sharing this. The map you produce looks impressive!
However, I thought that if 20,000,000 is way too many for a browser, it may be too many for users as well. While looking extraordinary, the problem with this map is that it shows too much information at the same time. Thus, usability of it suffers. The areas are so small and there are so many of them that users cannot just select what they need or want with a single click. They would need to zoom in first in order to be able to see clearly what they click on. But there is little information on where to zoom in.
I believe that usability of this application can be considerably improved by applying a “divide and conquer” multilayer approach. What if instead of cramming all your small regions into a single map, you display only countries (Scotland, Wales, England, Ireland, ...) first. When user clicks on a country, you show another map with that country only and regions in that country. And finally, when user clicks on a region of the country you show Local/unitary authority.
Such design will facilitate users’ navigation and also split your HTML into smaller, manageable pieces. In essence, that will implement a drill-down approach, which provides navigation through a hierarchy of regions.
If you are interested, I am planning to develop a SAS code sample and publish a blog post detailing this drill-down approach. Stay tuned.
We would definitely be interested in something like that, that kind of usability is exactly what we would like to do, we've just never had the tools to do it. At the moment we have to use what software we can depending on the size/ format of the shape file, so our recent publication mapping Higher Education Cold Spots (http://www.hefce.ac.uk/whatwedo/crosscutting/coldspots/) end up as a combination of static SAS maps, zoomable Google Maps and very much more user friendly Tableau maps. Will keep an eye out!
Sam, the SAS sample of drilling down through Google map is out, please see this link: http://blogs.sas.com/content/sgf/2014/11/28/drill-baby-drill-drilling-down-to-the-details-with-sas-and-google-maps/
How do you sort the order of drawing polygon?
When I re-ordered the lat/lng the polygon came out as a few of triangles so there is an order of lat/lng for each corner. Question is how would you sort it when you have more polygons like towns in a state?
Thanks.
You need to have your lat/lng pairs in such an order so they go from one vertex to another. Any two adjacent points lat1/lng1 and lat2/lng2 produce a line segment (or polygon side) of the polygon. The very last pair latN/lngN connects with the first one lat1/lng1.
Is it possible to use easting and northing instead of lat/long?
Sam, I am not aware of Google Map API directly using easting and northing coordinatates. At this point, your best bet would to convert easting and northing into latitude & longitude using one of the tools available, e.g. http://www.ordnancesurvey.co.uk/gps/transformation (single transformation), or http://www.ordnancesurvey.co.uk/gps/transformation/batch (batch transformation). If Google appends its API to handle easting and northing directly I would like to hear about it.
Thanks, I've since been able to find a way of converting between the two!
I can't seem to get it to work properly. The structure of my input SAS data set is
country polygon path lat long
england 1 1 XXX YYYY
england 1 2 XXX YYYY
...
england 2 1 XXX YYYY
england 2 2 XXX YYYY
...
scotland 1 1 XXX YYYY
scotland 2 1 XXX YYYY
...
and so on. I'm not sure which variable(s) to put in the first. and last. section of the code and anything i do put in it moans that the by variables are not properly sorted. Do you have any advice?
Thanks again for your help!
Sam, I believe you should first sort your data
by country polygon;then you use
first.polygonandlast.polygon.Pingback: Circling Google maps with SAS - SAS Users
Pingback: The power of SAS-generated InfoWindows in Google maps - SAS Users