There were 97 e-posters in The Quad demo room at SAS Global Forum this year. And the one that caught my eye was Ted Conway's "Periodic Table of Introductory SAS ODS Graphics Examples." Here's a picture of Ted fielding some questions from an interested user...
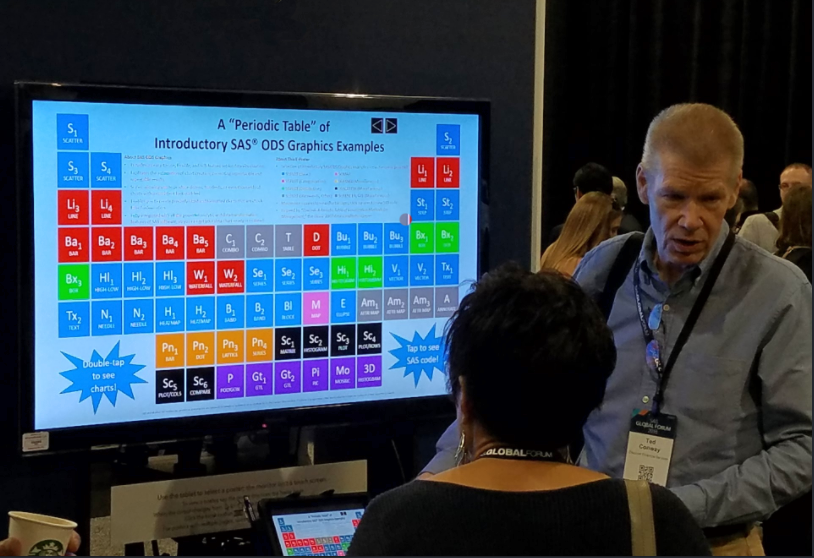
He created a nice/fun graphic, such that you could mouse over the boxes in the periodic table to see an image of the graph, and click it to see the SAS code. It's an interactive Powerpoint presentation with VBA macros, so unfortunately he wasn't able to fully demonstrate it fully on the tablets used at the demo stations. I thought that some other users might also have trouble viewing Ted's Powerpoint/VBA version on their computers, therefore I decided to create a simplified version to allow those other SAS users to still make use of the great information in his example.
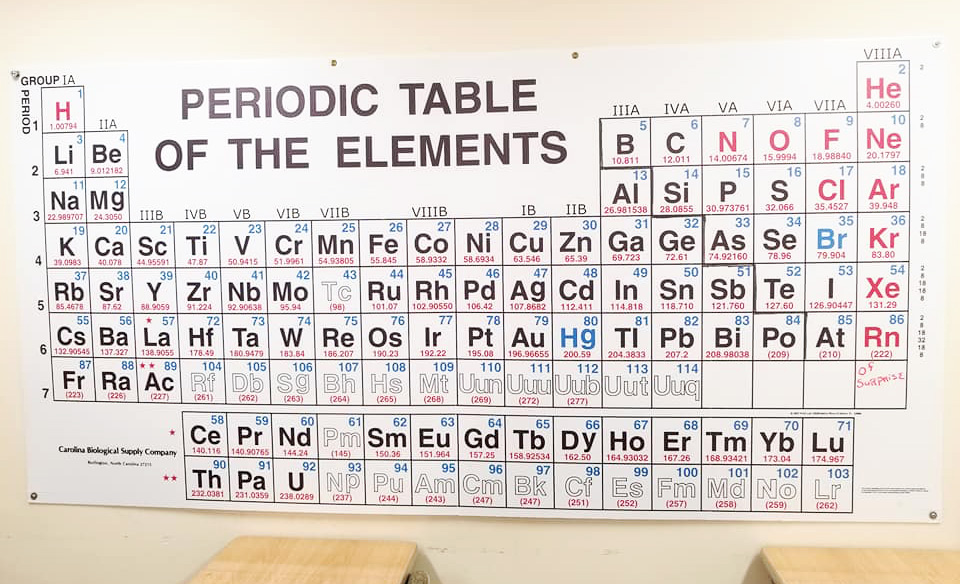
But before we get to my simplified version of Ted's poster, here's a photo of a real periodic table to get you into the mood. My friend Trena works for the U.S. Census Bureau, and also teaches a few classes in her spare time. Here is a picture of the periodic table hanging in her classroom. Does this bring back memories of your college or high school chemistry classes?
And now, let's get to that periodic table of graphics ...
I created my periodic table layout using SAS/Graph and a custom Proc Gmap, with ODS HTML output (which produces a simple png file, with an HTML overlay with the mouse-over text and drill downs). When you hover your mouse over the boxes, you see a text description of the graph, and when you click the boxes it takes you to an html page that shows the graph and the SAS code used to create it. It's not quite as snazzy as popping up the graph when you mouse-over, but it's more likely to work on a variety of different computers. Here's a link to my SAS code, if you're interested.
Below is an image/capture showing my new version of the periodic table - click to see the full-size interactive version. This simplified version should work on pretty much any browser on any computer. The mouse-over text probably won't work on smartphones/tablets with a touch-screen (since they probably don't have a mouse), but you should still be able to click the boxes to see the graphs and code.
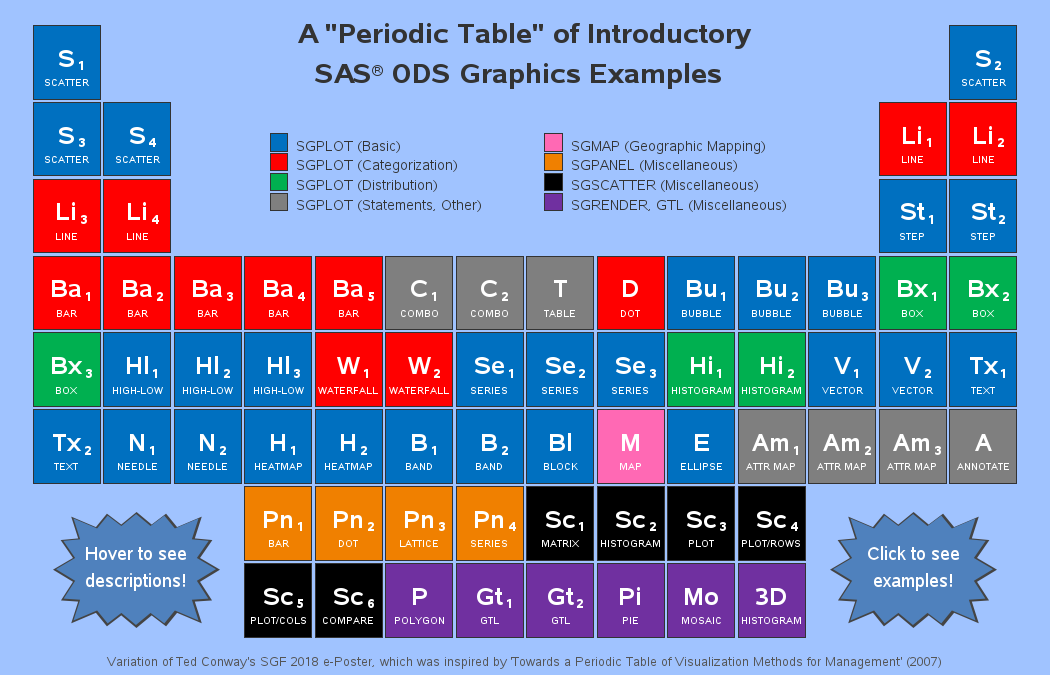
Hopefully you can use this as your starting point to get some simple code to start creating all these kinds of graphs - just swap in your similar data instead of the sample data, and you've got a basic graph that you can then start enhancing.
Note that Ted Conway gets all the credit for this ... he came up with the idea, the layout, and set up the code for all 68 of the examples. All I did was create a slightly different version of the top-level interface. (Thanks for doing the heavy lifting, Ted!)


5 Comments
Robert,
Great to chat with you in Denver, but you'll probably have expected a comment like this from me, but...
Why have you created a periodic table explaining ODS Graphics using SAS/GRAPH?
Shouldn't you have used ODS Graphics to create the periodic table instead?
............Phil
PS. I prefer to use ODS Graphics myself AND I have a doctorate in Chemistry!
My problem with your periodic table is that it doesn't seem to be categorized. I'd like all the scatter plots to be together in a column, and all the bar charts, line plots and box plots. By all means use the periodic table structure, but use the structure of the periodic table too!
When the only tool I know how to use is a hammer, every problem looks like a nail!
(one of these days I'll learn ODS graphics...) ;)
Thanks Robert, This is a great visual for newer users of SAS ODS Graphics to get an understanding of what options exist. I love how you built in interactivity to ensure the user can get more insight with a click. I will also print a copy for my wall at work! My printed copy could use an graph example on each tile as a visual prompt - maybe this could be made into a larger poster with examples of each graph on each tile.
Ahh! - Interesting suggestion!