For the past few years, I've been hearing from many news sources that Detroit is the most violent large city in the US. If the news is saying this, then the data should corroborate it, eh? Well, of course I decided to check for myself...
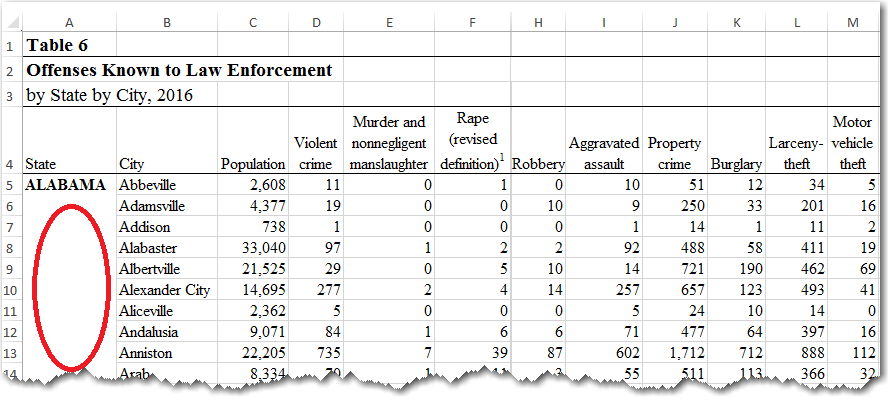
When comparing crime data across the country, the FBI's Universal Crime Reporting (UCR) Program is the go-to place for data. The 2017 data hasn't been finalized yet, so I went with the 2016 data. I downloaded the Excel spreadsheet for the entire US. The table looked something like this (notice that the state name in the first row for each state, which makes it a little tricky to work with):
I imported the spreadsheet into SAS using Proc Import, but of course the blank state values also appeared in my SAS dataset as ... you guessed it - blank!
SAS has been tweaking its software for several decades, adding functionality and flexibility, so there's almost no data-problem it can't fix. Here's the code I used to duplicate the state value into each following row that was blank. (Note: I frequently say "There are always at least 10 ways to do a given task in SAS" ... therefore there might be a better way to fix this data. This is just the first way that popped into my head. Feel free to share other/better ways in the comments!)
data rawdata (drop=state_single);
length state $20;
set rawdata (rename=(state=state_single));
retain state;
if trim(left(state_single^='')) then state=state_single;
run;
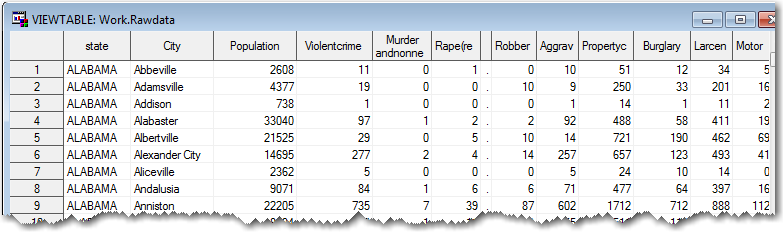
Here's what the resulting SAS dataset looks like:
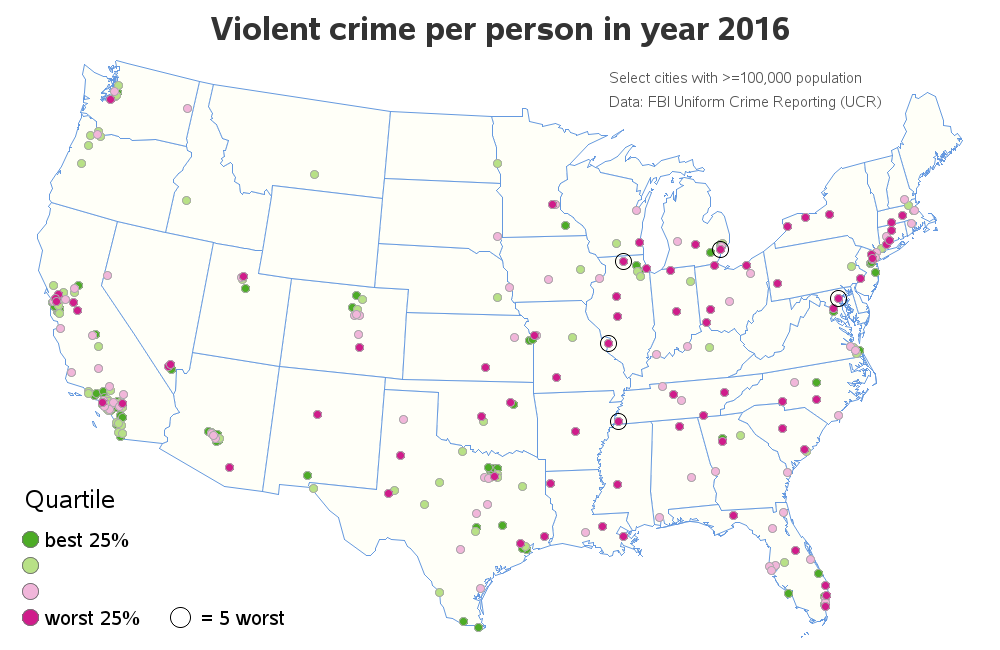
I decided to focus on the 'Violent crime' number, since most of the articles I had seen focused on some variation of that. And also, rather than using just the number of violent crimes, I wanted to combine that with the population, to get something like a "per capita crimes" that could be compared from one city to another. Most of the articles used "crimes per 100,000 people". Detroit usually had values around 2,000 violent crimes per 100,000 people, in most of the articles. I decided to strip off a few zeroes, in hopes that my number would be easier for people to relate to. I calculated crimes per 1,000 people.
I limited the data to just the cities with over 100,000 people, and I colored my markers by quartile (25% of the cities are assigned to each of the 4 colors). And to make it easier to quickly identify the worst cities on the map, I drew a circle around the markers for the 5 worst cities. Below is my map (click the image to see the interactive version, with HTML mouse-over text for each city).
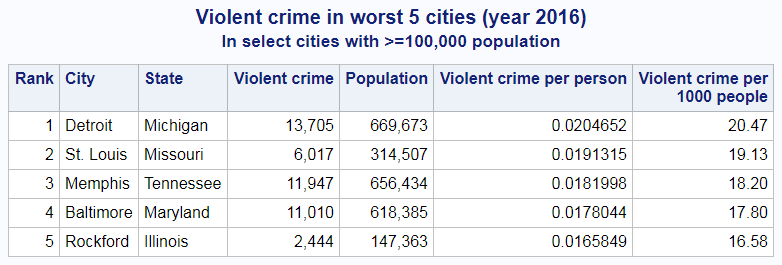
The map & table show that Detroit has the worst violent crime rate, therefore I'm done, right? ... Well, not exactly.
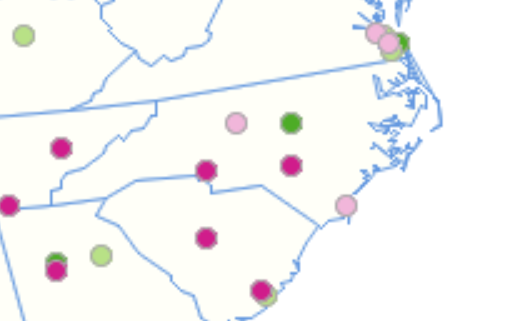
I decided to do a few spot-checks. Here in North Carolina, the city that gets in the news a lot for murders and such is Durham - I wondered how it compared to Detroit. But I couldn't find Durham in the map, or even in the original UCR spreadsheet. My map (zoomed partial screen-capture below) had Charlotte, High Point, Cary, Fayetteville, and Wilmington ... but it didn't show the other NC cities with >=100,000 people (Raleigh, Greensboro, Winston-Salem, Durham, and High Point).
If NC was missing five major cities, how many cities might also be missing in other states? And can you really say Detroit has the highest violent crime rate of any major US city, if the UCR data doesn't include *all* the major cities?
So I categorize this data as interesting, but not conclusive/definitive. What's your opinion?


5 Comments
I think it would require some additional analysis to say whether or not that is true. Anybody got any suggestions for types of graphs that might help?
SLAM SIR, I AM A STUDENT OF BI IN NCBA & E MULTAN I APPRECIATE YOUR RESEARCH AND I LIKE YOUR WORK. I AM ALSO RELATE THIS FIELD AND WORK AS STENOGRAPHER IN JUDICIARY DEPARTMENT TO CHECK AND BALANCE CRIME BUT I SUGGEST YOU TO GIVE AWARENESS OVER THE WORLD WIDE CRIMES NOT LIMITED TO SOME CITIES OR COUNTRIES. THANK YOU.
Long ago, when I lived and worked in Detroit, the city was listed as the "murder capital" of the US. I helped someone analyze data about all of the homicide cases in Detroit for the previous 40 years. The vast majority of the cases had been solved, so he was interested in the "why".
He found that in almost all cases (more than 98%) the victim and assailant knew each other. Most (more than 90%) of the cases were either some kind of domestic violence, where the victim and assailant were related to each other, or were related to illegal drugs. His conclusion was that you were relatively safe if you didn't have family arguments while armed, and if you stayed away from the illegal drug trade.
I don't have any current data, but I suspect that today's stats would not be all that different.
This result is very interesting.
In my feeling, most interesting point is that if there are many points in one area, best 25% and worst 25% are often very near.
(California is a good sample of this)
Can we say "If there are many people, there are both of many good guys and many bad guys"?
Or any possibility about this?
I think it would require some additional analysis to say whether or not that is true. Anybody got any suggestions for types of graphs that might help?