The first time I voted (back in the 1980s), I was very surprised that I didn't have to show any kind of identification. I assumed it was because I lived in a small North Carolina town of 300 people where "everybody knew everybody" ... but they told me that nobody in NC needed to show an ID to vote. And now, 30+ years later, I was equally surprised to learn that different states have different rules about requiring (or not requiring) people to show an ID to vote. This is an interesting topic - so I decided to delve into the data...
But before we get into the voter-ID data, let's have a look at a different kind of ID... This is my friend Amy's cafeteria meal card ID from NC State University. Pretty nice for an ID card photo, eh!?! Hmm ... I wonder if this would be an acceptable form of ID for voting, in some states? The earrings make it look like the photo is from the 1980s - but it can't be, because Amy's not old enough to have been in college that long ago! ;-)

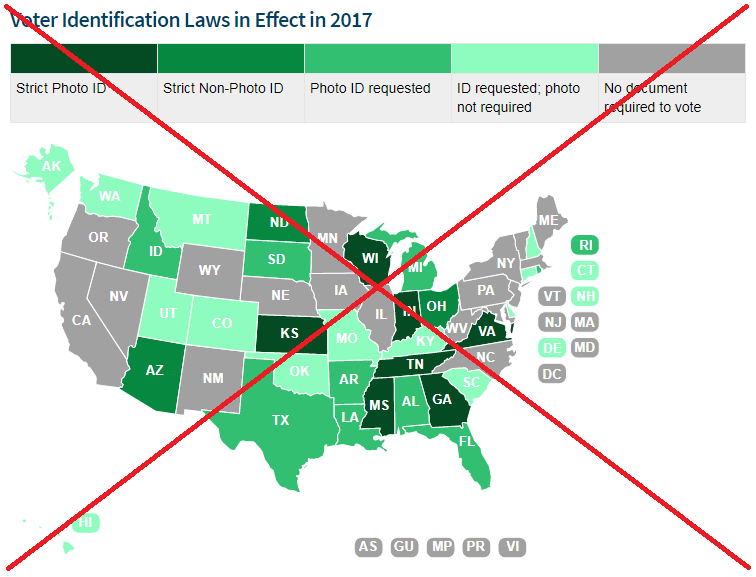
And now, let's get back to the data analysis... After a bit of Google searching, I found some data on the topic of voter ID. I was especially happy to see that it was provided in the form of a map. Their map seemed to cover the basics, but I didn't like the odd placement and layout of the legend - it's really big, and it separates the title from the map.
So I decided to create my own improved version of their map. I used the same color scheme, but I went with a traditional legend using small color squares - this allowed me to move the title closer to the map, and make it more prominent. And rather than trying to fit state labels onto all the states (which becomes problematic with the small states), I use HTML mouse-over text. Click the map below to see the interactive version with the mouse-overs. I also added a footnote showing the source of the data.
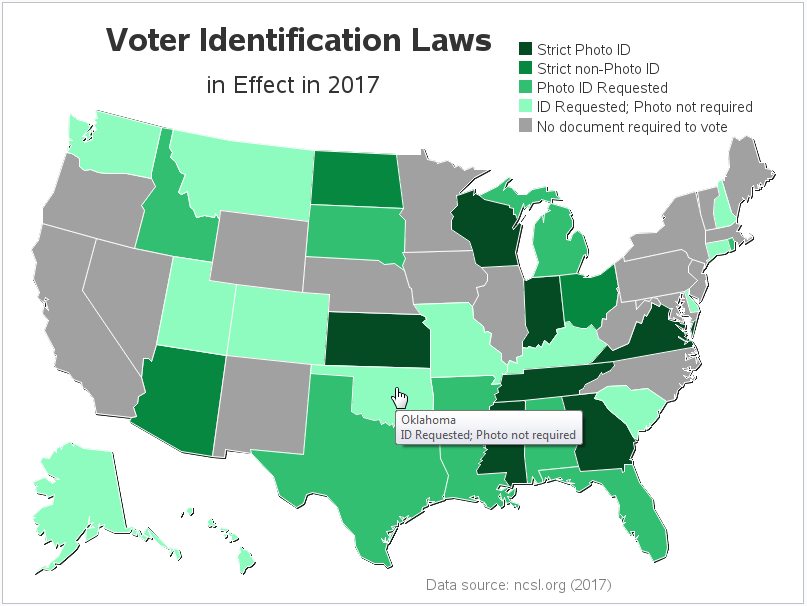
The above maps are interesting and informative, but the more I studied them, the more I realized that the gradient color might not be the best choice for this data.
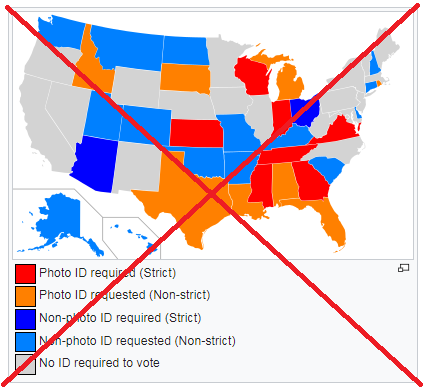
So I did some more searching in quest of a better map, and found the following on Wikipedia. It uses a red color scheme for photo ID, and a blue color scheme for non-photo ID. Perhaps it's just my personal preference, but I think this shows a bit more information, and gives me a better understanding of the data. I preferred the Wikipedia map, but alas it didn't have labels or mouse-over text for the states, nor a title.
So I decided to create my own version, using the Wikipedia color scheme ... but add titles, footnotes, and mouse-over text. Another subtle change I made was arranging the legend in a slightly more intuitive and space-saving manner.
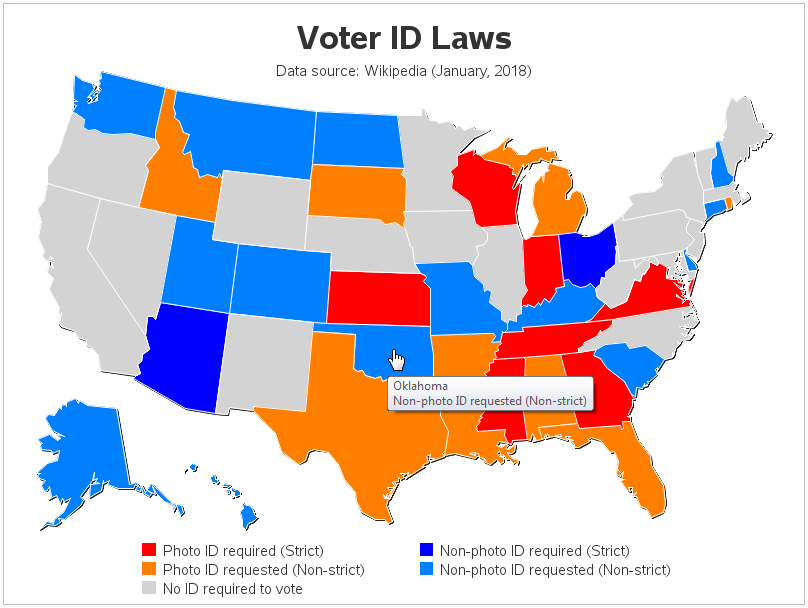
I'm still not sure which color scheme is best. Which do you prefer? Perhaps it depends on what questions you're wanting to answer about the data. And of course I always recommend looking at the data plotted in several different ways to get a better and more complete understanding - so having two maps isn't necessarily a bad thing!
My suggestion ... Check the official government database(s), and if a person is in the database as having an id (such as drivers license), then require them to show it to vote. That way, at least, someone can't just show up and say they're somebody else and vote for that person.


7 Comments
Can you make one that doesn't have blues and reds? (so we don't confuse it with the prevalent party in that state). Try purple, green, grey, orange, brown..etc.
Also, can you make a map that shows 3 things:
Breakdown of ID required
Electoral Votes in each state
And if that state was counted as (R) or (D) in the last election? (similar to how they did it in this map: http://www.270towin.com/presidential_map_new/maps/bRgO6.png)
Thank you and please let me know if I can help in any way.
Some other color variations might be interesting. Here's the code used for both of my maps, if you'd like to experiment with using different colors (you can modify the colors in the pattern statements):
http://robslink.com/SAS/democd96/voter_id_laws_2018.sas
http://robslink.com/SAS/democd74/voter_id_rules_2017.sas
I live in Kentucky and I have had to show my driver’s license for several years. That doesn’t match your graph.
Although a driver's license would suffice, I don't think Kentucky requires a photo id. Here is the rule they list on a Kentucky .gov page: https://elect.ky.gov/Frequently-Asked-Questions/Pages/Election-Day-Information.aspx
"All voters must produce identification or be known by a precinct officer prior to voting. Acceptable types of ID are personal acquaintance of precinct officer, driver’s license, Social Security card, county issued identification card approved in writing by the State Board of Elections, U.S. government-issued identification card, Kentucky state government-issued identification card with picture, credit card, or another form of ID containing both picture and signature."
I'd probably want a footnote or something to explain what "strict" and "non-strict" means. I have an idea what it means (only certain IDs accepted), but that's not the same as knowing. Maybe add the number of acceptable IDs for strict in the mouse-over text?
I was also wanting to explain that on the graph, but it would have taken a bit too much space (about a paragraph) ... so I made the 'Data source' footnote a link to the original article, where they explain it in-depth :)
Wow. Only 7 states require ID to vote.