Over the New Year's weekend, I was listening to the re-broadcast of Dick Clark's Top 100 music countdown from the 1980s ... it was the music from my high school and college years, when synthesizers and fun-rap music popped onto the scene. Another thing that started in the 1980s was the Internet, and .com websites. So, similar to the music countdown, I thought it would be interesting to see some kind of .com countdown!
But before we get into the data analysis, here's a picture to get you into the right mood. It was the 1980s, and we were all going high-tech with computerized and digital everything. And what represents that better than a calculator watch! (Thanks to Jenni's friend Zachary for letting me use this cool picture of his watch.)

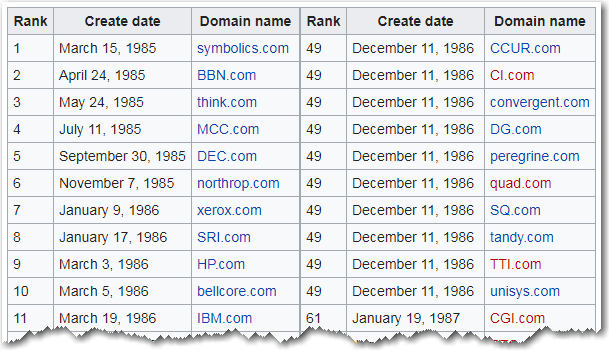
And now, let's analyze some 1980s data ... After a little Google searching, I came across a Wikipedia list that purported to be the "100 oldest still-existing registered com domains". Below is a screen-capture of part of the list - you might notice that it's a little difficult to get your brain around - especially with the visual layout they chose (they used two columns ... but it's not visually obvious they used two columns).
I copy-n-pasted the data from the table into a text file, and read it into a SAS dataset. I was ready to create a visualization ... but what would be the best way to plot this data? I could use a scatter plot or a bar chart and plot the 'create date' along a time axis, or maybe even use a step line chart to show the cumulative number of sites as time went by ... but none of those seemed appropriate.
I finally decided on a calendar chart. It just seemed to sort of 'fit' the way I wanted to see this data. Here's the first version:
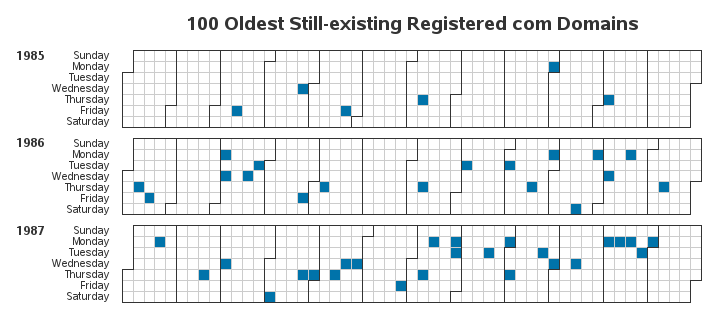
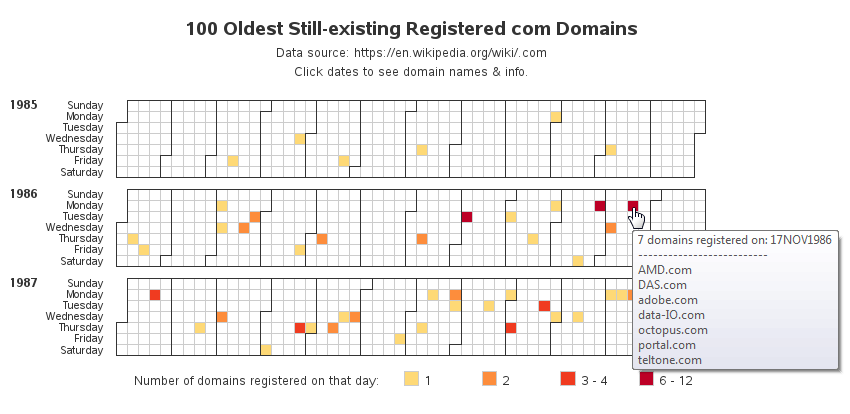
The calendar chart was starting to give me a good mental image of the data - it showed that the earliest com domains were few and far between (time-wise), and after a couple of years went by, more & more got registered. But wait! ... what if multiple domains were registered on the same day?!? The above calendar chart doesn't show that! So let's improve the chart, and color-code the days based on how many domains were registered. Also, notice that I provide a list of all the com domains registered that day in the mouse-over text (click the image below to see the interactive chart).
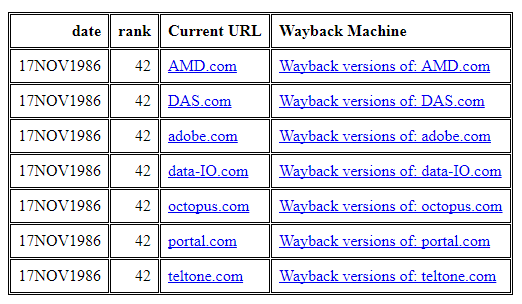
Knowing the names of the com domains is nice, but of course now you want to go to that URL to see what their web page looks like. It would be a shame to have to re-type each URL into a Web browser, eh? I could make a drill-down link for each day on the calendar chart, but that couldn't handle the days that have multiple URLs. So I have the calendar days drill-down to a table, and then the table has links for each URL. Actually two links for each URL - one goes to the current version of the page, and one goes to the Wayback machine where you can see the old/historical version. Here's a screen-capture of the table for November 17, 1986:
What year did you first "get online"? Do you remember the first Web browser you used, and some of the first URLs you went to? (if you remember - please share them in a comment!)
This example demonstrates several pretty neat SAS programming tricks (creating the calendar chart, stuffing data from multiple data observations into a single mouse-over text, and adding links to items in a Proc Print table). If you'd like to see the details, here's a link to the actual SAS code.

4 Comments
Hi Robert. I really enjoy reading your blogs and learning more about mapping and graphing.
I'm trying to adapt this map slightly and dont need the proc print at the end. When I remove the footnote statement just above the Proc Gmap to get rid of the large white space at the bottom of the page, I lose the Day of Week and Year to the left hand side of the map.
Any ideas how to remove the large space, but also retain the mapping format?
Thanks
Simon
When you get rid of the footnote, you could also try using a smaller "goptions ypixels=".
You could also use a blank title on the left to guarantee white-space for the annotated text, such as:
title4 a=90 h=20pct ' ';
First web browsers I used were NCSA Mosaic and Lynx (a text-based browser). This would have been around 1993. I don't remember much about websites other than using Lycos and AltaVista as my search engines.
Ahh - I remember good-old Mosaic! I used it on the Unix workstations at NCSU! :)