Donald Trump is pretty spry and energetic for an old guy - he's currently 71 years old, and seems to have more energy than I do (and I'm about 20 years his junior). But is he the oldest US president? Well, as with many questions ... it depends. Follow along as we analyze some data about all the past US presidents, and create graphs that answer this and many other questions!
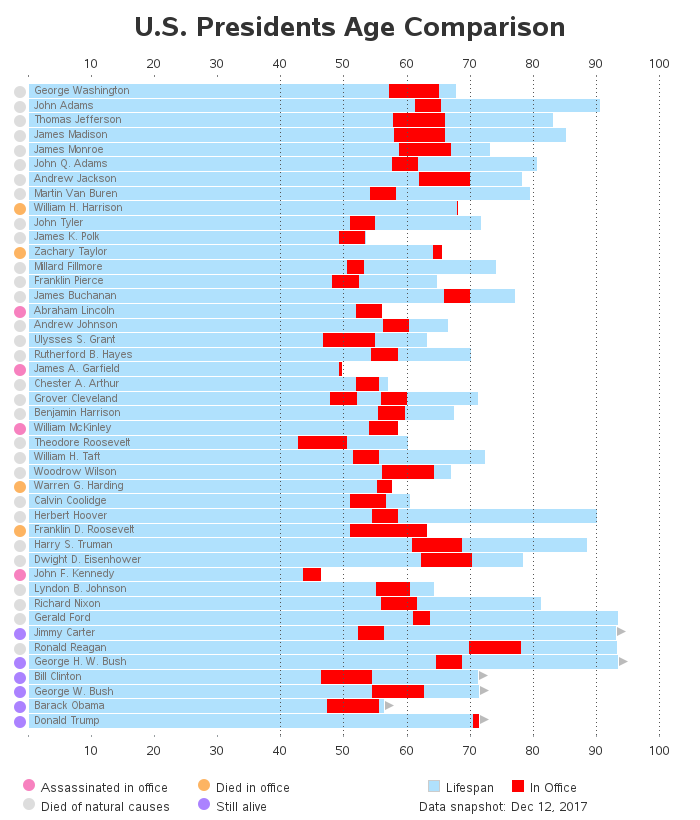
Here's the graph that got me thinking about this topic. It was created and posted on the 'data is beautiful' reddit forum, by the user Brennejm.
It was an interesting graph, but there were several things I wanted to improve.
- First, the age numbers along the axis were too small to read.
- There were too many bold, attention-grabbing colors, so I didn't visually know what to pay attention to.
- The color legend represented two distinct things ... but it was not obvious they were two distinct things.
- The small colored bar segments along the left visually appear like they are part of the age bars, artificially increasing the perceived length of the bars.
- There is no date stamp letting you know when the graph was generated (each day, the bar lengths of the living presidents get slightly more out-of-date).
- There is a typo in at least one of the names (Jonh Adams).
- And there is no title to tell you what the graph is all about.
I decided to use some data from Wikipedia, and create my own version of the graph. Here are some of the changes and customizations I made:
- I made the ages text along the axis larger and easier to read.
- I moved the presidents' names to the inside of the bars.
- I used a lighter color for the main part of the bar, and a bright color for just the presidential term of office.
- I used colored dots to show how the presidents died, rather than the small square bar segments.
- I chose different colors for the dots (it didn't seem right to use orange for 'still alive').
- I show separate color legends for the dot colors, and the bar segment colors.
- I added an arrow to the end of the bars for the still-living presidents (showing that their age continues to increase).
- I copy-n-pasted the data from the original source, reducing the chance of making typos myself.
- I add a title describing the graph, and a footnote with a date stamp showing when it was created.
- And, if you click the image below, you can see the interactive version with HTML mouse-over text showing the exact age data for each bar segment.
So, who's the oldest US president? If you mouse over the interactive graph, you can easily find that ...
- Donald Trump was 70.6 when elected as president, making him the oldest elected to his first term as president.
- Ronald Reagan was 78.0 at the end of his last term, making him the oldest serving as president.
- And at 93.5, George H. W. Bush has reached the oldest age of anyone who has served as US president.
Tricks and technical details
This was some fun data to explore, and the new(ish) SAS yrdif() function certainly made it easy to calculate the ages. As with most of my graphs, I used a lot of data-driven annotate to customize things like: adding the colored dots to the left, moving the president names from the regular position to inside the bars, and adding the age axis to the top of the graph. And I used Proc Gplot's note statement to create the custom legend at the bottom of the graph.


7 Comments
I'd like to learn how you annotate the graph. Could you share your code?
Thanks.
Certainly! ... http://robslink.com/SAS/democd96/us_presidents_timeline_info.htm
When I cut and paste your code into SAS, there cards aren't read in correctly. I think that it is not detecting the tabs somehow. Do you know how to solve this problem?
Cheers.
When I copy-n-paste the code from Google Chrome into a Unix 'vi' editor session, the tabs are still there. I run my SAS jobs in batch from the command line. Are you perhaps trying to run the code from a DMS SAS program editor window, or EG, or some other GUI interface?
I was running the code from a DMS SAS program editor. I assume that it didn't transfer the tabs correctly because when I cut and pasted the datalines into a text file and input the text file, it all worked. Thanks for posting the code and for the quick response.
Thanks for the data viz. For a different visualization of the ages of US presidents, see my presidential timeline visualization. The comments to that post contain two other visualizations,
Rick Wicklin shared another way to visualize this using a vector plot, which is perhaps a bit unconventional for popular media -- and yet, I find it easier to read. It conveys the relationship of terms across time, crossed with the age at election and during the terms.