I recently read an interesting article about petroleum coke (petcoke). A lot of it is produced in the US, and lately a lot of it is consumed (burned) in India ... contributing to air pollution there. The article mentioned some numbers in the text, but the data was really begging to be graphed. So, of course, I graphed it!
Petcoke is what's left over after refining tar sands oil and other heavy crude. It burns hotter than coal, but produces a lot more carbon and sulfur pollution. The article says "Laboratory tests on imported petcoke used near New Delhi found it contained 17 times more sulfur than the limit set for coal, and a staggering 1,380 times more than for diesel" (the burning of petcoke in India is largely unregulated, according to the article).
The article claims the US is the world's largest exporter of petcoke, and India was the largest importer of US petcoke last year. I did some digging, and found that the US Energy Information Administration (EIA) website has data about the US exports of petcoke. I downloaded the data in spreadsheet form, imported it into a SAS dataset, and created some graphs. First, I decided to plot the total exports by year. Looks like the numbers have been going up the past few years, and we export about 200 million barrels.
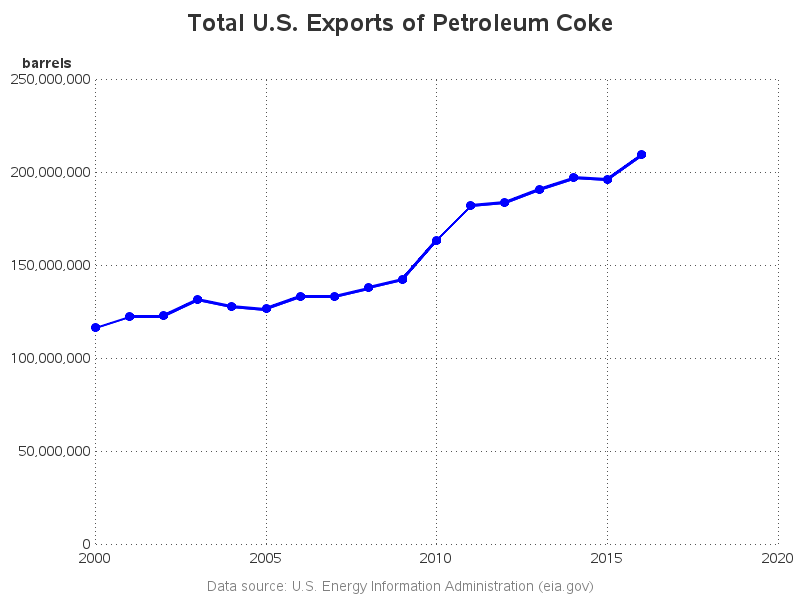
Here are some of the 'tricks' I used in the graph, to make it communicate effectively.
- The values in the spreadsheet were in "thousand barrels" - I converted them to barrels ... because who wants to have to do the math in their head for "250,000 thousand barrels".
- I placed a dot marker along the graph at each data point, so you can easily see that the plot represents yearly values.
- I start the y-axis at zero, so you get the visual perception of percent change over time.
- I added reference lines, so it's easier to detect slight increases in the blue line.
- I make the reference lines lighter gray and dotted, so they don't compete with the blue data line.
- I add a footnote to the bottom of the graph, documenting what the data source is.
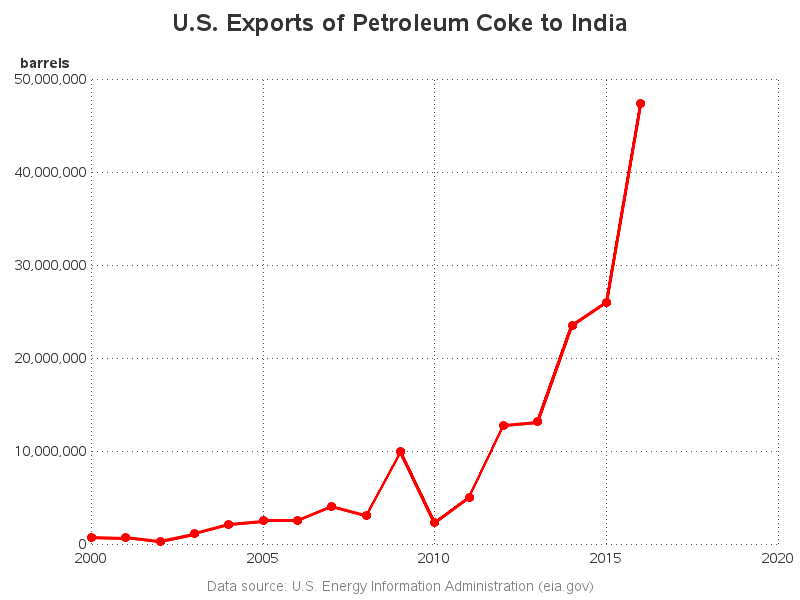
Next, I plotted just the exports to India. Wow - they have really increased lately! The 2016 amount is near 50 million barrels, which is about 25% of the ~200 million barrels of total US exports, just like the article claimed. The article mentions that this amount of petcoke could fill the Empire State Building eight times!
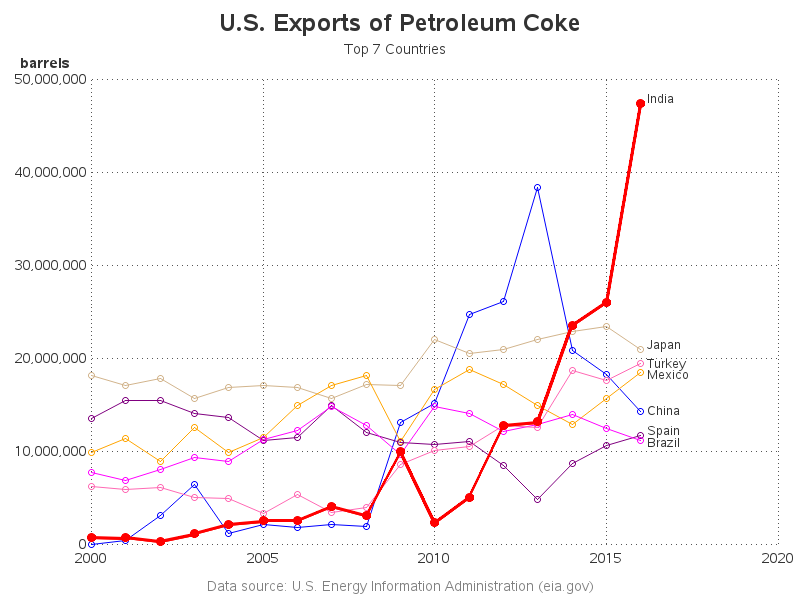
The EIA data also contained the data for other countries, so I decided to plot the seven top importers of US petcoke, to see how they compared. There has been some interesting movement in the chart - especially with India and China. Looks like they both started importing larger amounts of US petcoke in 2009, and then in 2014 & 2015 China decreased their imports while India increased theirs by about that same amount (I did a Google search, and the following article popped up which might explain some of the movement in the China and India graphs). Then in 2016 India's imports increased by a considerable amount. Turkey's imports have also been increasing steadily for the past few years.
What are your predictions for the future? Will India continue to use more petcoke, and China continue to use less? How will this affect the smog and pollution in their cities? Is the burning of petcoke having an impact on pollution worldwide?


4 Comments
Thanks for sharing this great insight.
But I wish you could share those public available data and SAS/Graph code to Github. In this way, SAS technology has more exposure.
Here's the next-best thing ... a direct link to the SAS code! :)
http://robslink.com/SAS/democd96/us_petroleum_coke_exports_info.htm
Not all processing of tar sands oils produces waste. Check out the technology invented by Petroteq which removes the oil from the sands and the only left over material is clean sand.
Ahh! - Sounds like we need to do more of this kind of processing, and less of the other kind! :)