The most highly anticipated business announcement this fall is probably the location for Amazon's second headquarters (dubbed HQ2). Amazon plans to spend $5 billion on their HQ2, and employ about 50,000 people in high-tech jobs. They received 238 proposals before their October 19 deadline, but haven't announced a winner yet. Let's analyze some data, and see if we can determine which cities might be the most likely to win ...
CNBC recently performed an interesting analysis that might provide some useful insight. They took data from their 2017 America's Top States for Business study, and combined it with some US Census data, and came up with measures for how well various areas met Amazon's main requirements. They summarized their results in tabular form, and below is a partial screen-capture:
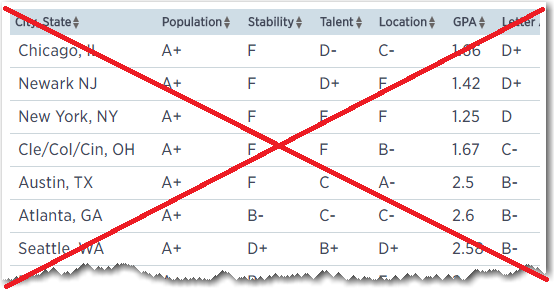
Their table is ~OK, but I had a few complaints. I wasn't real fond of how they abbreviated some of the city names, and the table comes up in no particular order (requiring you to click the column headers to sort the table in a meaningful order). Also, their table has no title.
After a bit of studying, it seems that their numeric GPA is the most important (and granular) measure to sort by. I created a SAS version sorted by GPA, and now you can quickly see which cities had the highest score. Here's a partial screen-capture of my SAS table (note that I removed the cities with GPA=0, and also removed Seattle since it is already the home of Amazon's current headquarters).
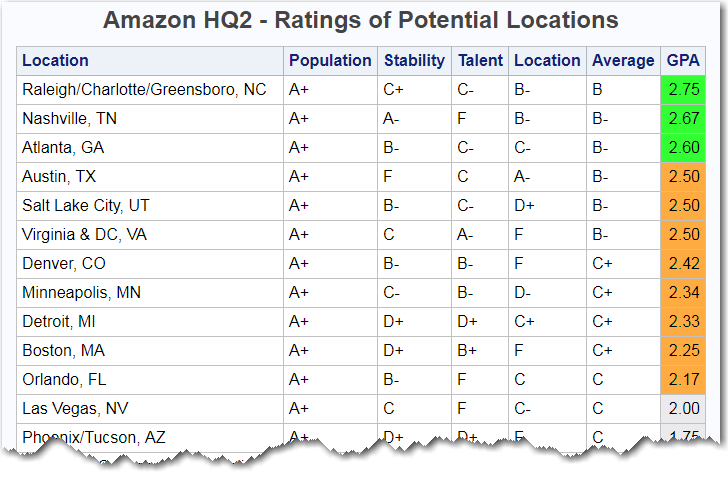
I was happy to see that my area (Raleigh, NC) came out with CNBC's top score! And the other top cities also appeared to be in nearby states. But it was difficult to quickly determine if there were geographic trends. The Graph Guy in me said "This data seemed ripe to plot on a map!" I did a bit of web searching, and found one such map - it used slightly different data, but was on the same topic.
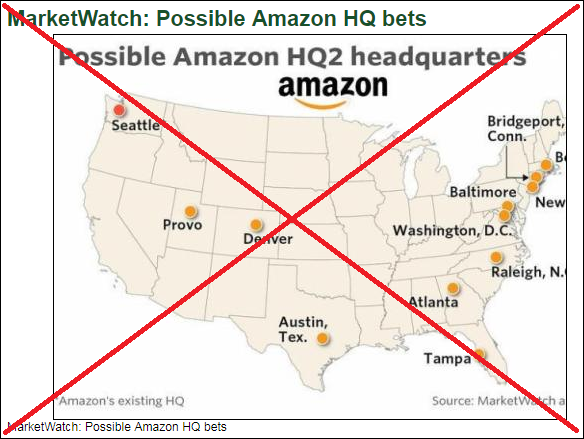
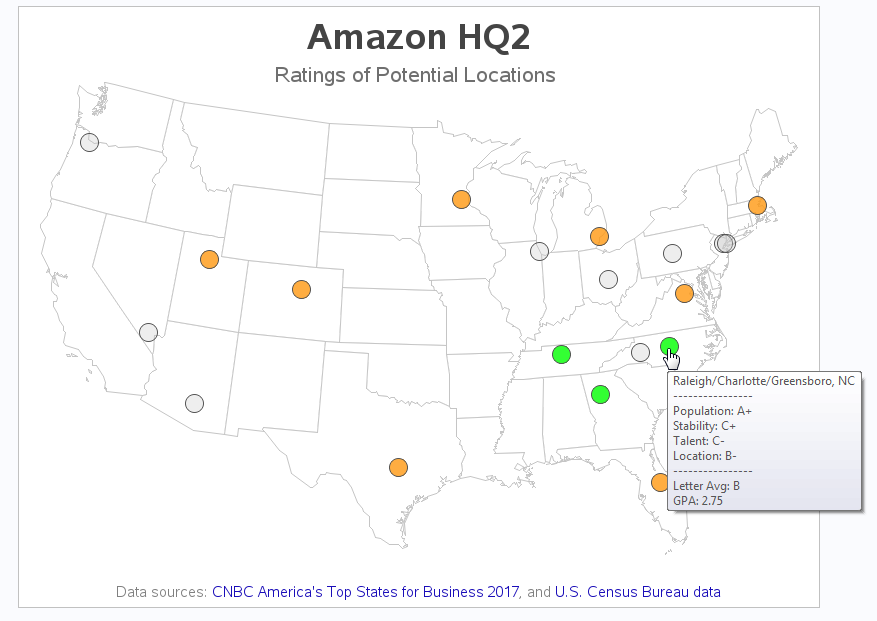
The Marketwatch map seemed pretty weak, in my opinion. So, of course, I decided to create my own SAS map, to see if I could do a little better. The main improvement in my map was that I color-coded the markers based on the CNBC rating scores (using the same colors that I used in the table). Also, instead of trying to fit the city names on the map, I show them in HTML mouse-over text (click the map screen-capture below to see the interactive version). In addition to the city names, I also show the grades in all the CNBC rating categories in the mouse-over text. Oh, and you can click the city markers to launch a Google search!
How did your city score in the CNBC analysis? Do you agree, or disagree, with the scores? What suggestions do you have for an even better analysis? :-)

3 Comments
Recently I was in Detroit where the natives thought that a Canadian city was most likely to be chosen. They thought some of the advanced robotics was going to be the sure sell. The sad note is that many hoped Amazon would choose Detroit to assist with the city's comeback.
I of course hope that RDU is chosen but agree with the other "A" cities listed.
Neat!
What rule did you use to locate the multiple city sites (e.g. three in Ohio)?
Good question! Where they have grouped multiple cities together, I arbitrarily/visually selected a location in the state, and hard-coded the lat/long in my code, such as ...
if city='Cle/Col/Cin' then do;
lat=39.9580708; long=-82.85602;
end;