One of the great things about living in an area that has seasons is you get to see the leaves change colors in the fall. If you're a big fan of seeing the leaves at their peak, you could actually travel around the country and see the leaves at their peak for several weeks (a la surfers traveling around the world to have an Endless Summer). And in order to try that ... you might need a map!
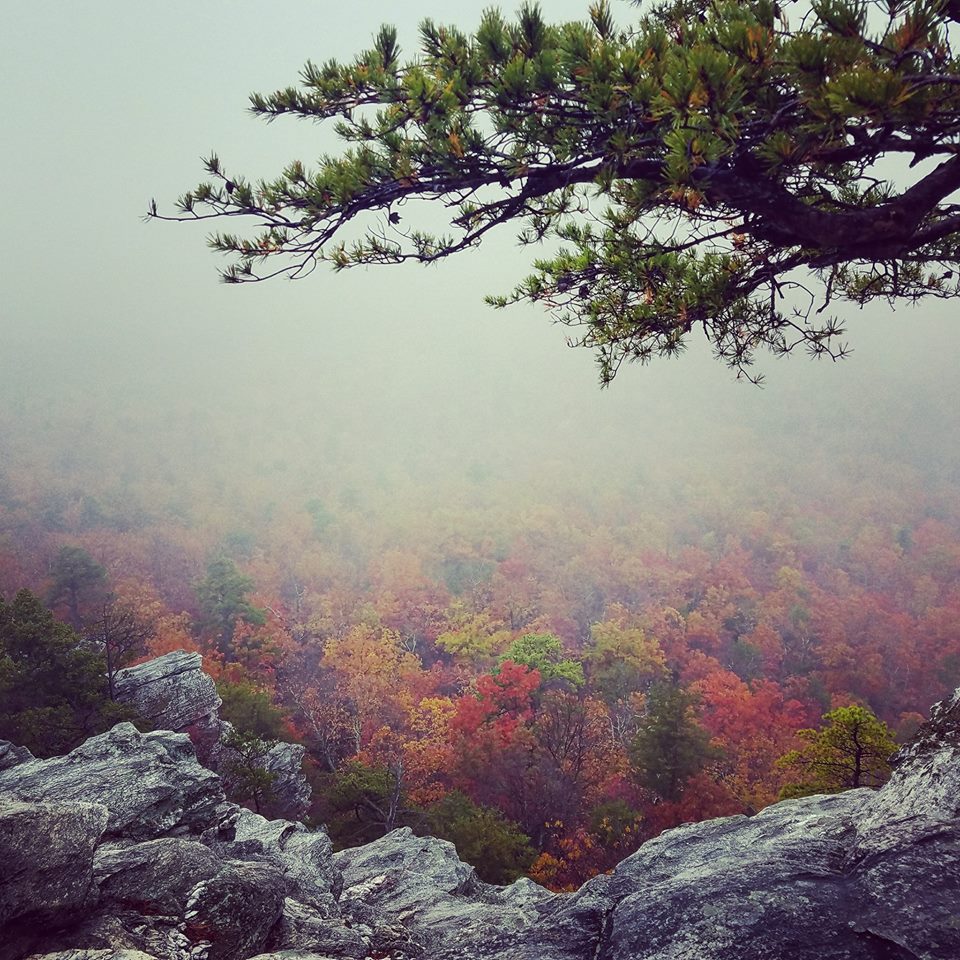
Before we create that map, here's a picture of some great fall leaves from my friend Eva. She took this wonderful picture at Hanging Rock State Park, right here in North Carolina:
The Smoky Mountains website has an interactive map to help track when the leaves will be at their peak (see screen-capture below). You can select the week, and then see a color-coded map. It's pretty cool - click here to try it out:
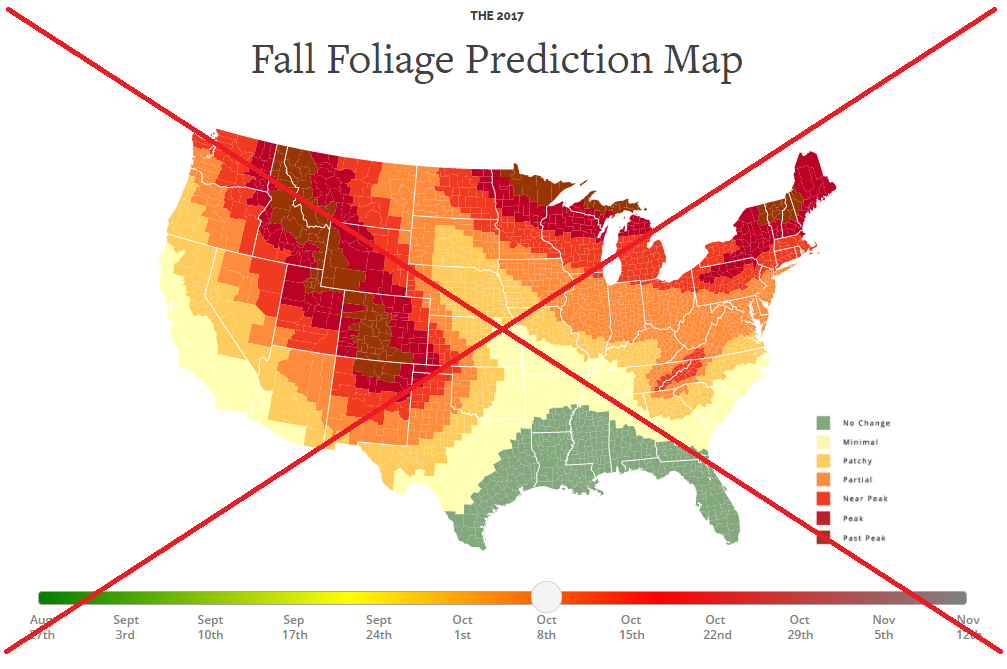
But as I played with it, I started noticing a few deficiencies (you know how picky I can be!)
- The text in the color legend was a bit small and difficult to read.
- The week-selector-bar under the map had a gradient color ... but the colors didn't really seem to have anything to do with the map.
- The year & dates were very small, although that was the most important text on the map.
- The light colored county & state borders let the yellow color visually blend in with the white background.
- And there was nothing to help you find out the names of the states (for those who are a bit geographically challenged).
So, of course I decided to create my own version, to see if I could make a few improvements! Thankfully they had the data available on their webpage, and I wrote some SAS code to read the foliage-2017.csv file directly from that location. I transposed the data, assigned date values to their time increments ... and then I was off to the races! Here are a few of the improvements I made ...
- I made the text in my color legend larger & bold, making it easier to read.
- I eliminate the week selector bar, and set my map up as a gif animation, playing in an endless loop (so you don't have to select the week).
- I made the date and year about twice as big as the other text.
- I eliminated the county outlines, and made the state outlines gray instead of white - now the yellow color gets visually separated from the white background.
- And I created an HTML overlay with mouse-over text so you can easily find out each state name.
Below is my gif animation - I invite you to click this link to view the version with the HTML overlay, if you want to see the mouse-over text with the state names.
Now all you need is a motor home or camper, and a few weeks of vacation, and you can have that "Endless Fall" trip you've always wanted!
Map showing when fall leaves are at their peak! Click To Tweet


1 Comment
Now it's time to find snow cover data!