In growing areas such as the Research Triangle Park, there is always the tough decision between developing land for business, or keeping it natural for parks and recreation. SAS is fortunate to have the great hiking trails at Umstead Park just across the road to the north - it's the most-visited state park in North Carolina. And just one exit to the west is the great paddling, rowing, sailing, and biking at Lake Crabtree Park (which I featured in a recent blog post). Both of these recreation areas are adjacent to the Raleigh-Durham airport, and the land in between could either be used for further airport/business expansion, or more recreational/nature area. In this blog post, I create a custom map to examine the contested area.
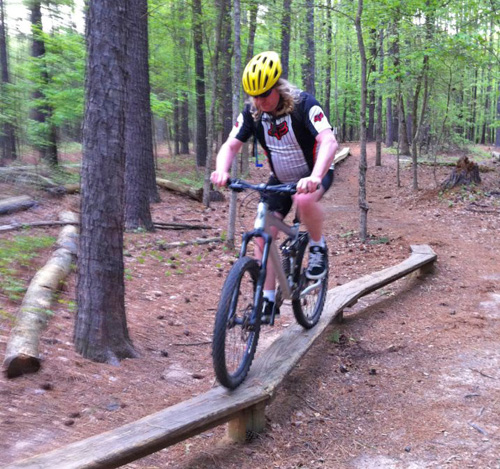
To get you into the mood for this topic, here is a picture of my buddy Paul riding his mountain bike on one of the trails in this park area:
This past weekend, I spent my Saturday helping restore a grand old Sycamore Mess Hall building (formerly used by various camps and such) at Umstead Park. My job was to scrape old paint off the ceiling of the kitchen ... for 4 or 5 hours. During the lunch break, I got into an interesting discussion about the history of Umstead Park, and the potential future. I found out that the airport had originally bought a large chunk of land thinking it might need an extra runway, but had later determined they wouldn't need it. The airport then decided to investigate what other options might exist for the land, and there are several proposals being evaluated.
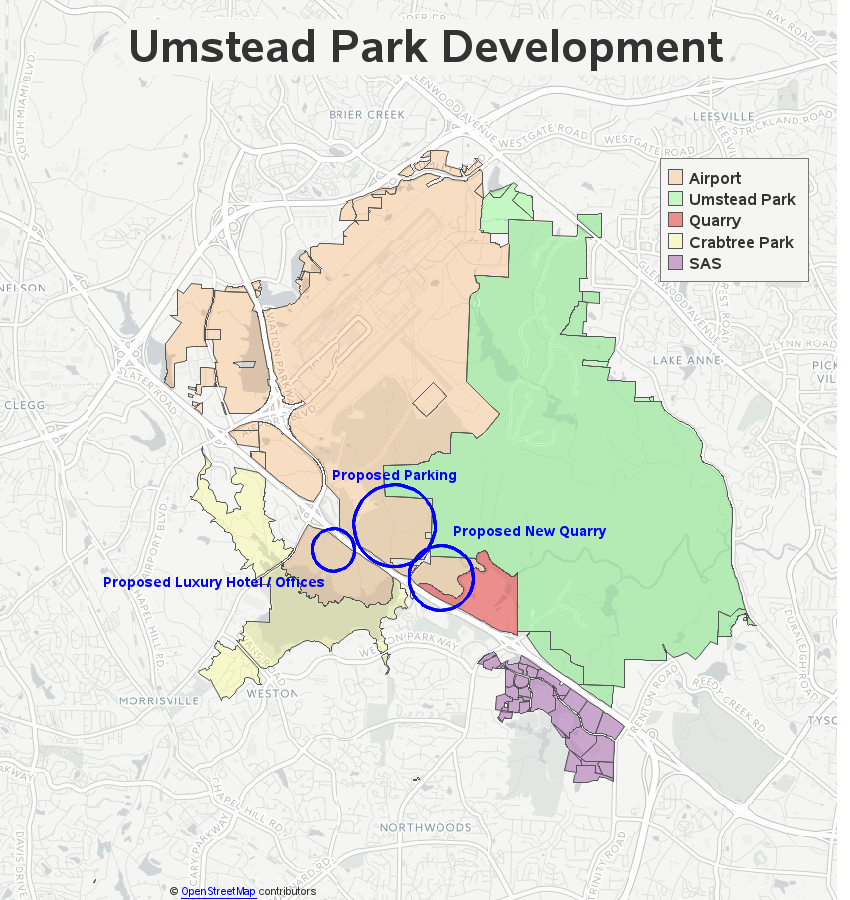
- On the Umstead Park (north) side of I-40, there is currently a rock quarry on the edge of the land, and as the rock runs out in the current location, they'd like to expand into the airport land.
- Also on the Umstead side, there is a proposal to add more satellite parking for the airport.
- On the Crabtree Lake (south) side of I-40, there is a proposal to build a luxury hotel and office park, with a nice view of the lake.
I had a 'mental image' of all these locations, but I wanted to create a real image ... in the form of a map! Here's what my map looks like (click the image below to see the full-size interactive version with HTML mouse-over text, and drill-down links). If you'd like to create similar maps using SAS, I've included the technical details in the second half of the blog.
There are several key players with a vested interest in the negotiations over the contested land, such as: RDU airport, the RDU Airport Authority, Wake county, state of North Carolina, The Umstead Coalition, Triangle Off-Road Cyclists (torc), and RDUForest.com. I invite you to visit their websites to read more on their plans & preferences for the land, and you can even sign up to help or make suggestions on some of the websites.
Do we need more development, or more parks, in the RTP NC? Click To TweetTechnical Details for Creating the Map
You've probably never seen a SAS map quite like this, and if you're a SAS programmer you might be asking "How'd he do that?" Well, I'm terrible at keeping secrets, so here are all the nitty-gritty details:
First, I downloaded the Esri shapefile for the Wake County property parcels from their website. I extracted the zip file, and then used Proc MapImport to convert the shapefile into a SAS dataset suitable for plotting with Proc GMap, using the following code:
proc mapimport datafile="Wake_Property_2017_10.shp" out=umstead_area;
id pin_num;
run;
The shapefile contained projected x/y coordinates, but I wanted the longitude/latitude coordinates. Therefore I used their Wake_Property_2017_10.prj file to determine what projection was used. I fed the file into the prj2eps website, and found that the "2264 - NAD83 / North Carolina (ftUS)" projection had been used. I then used that information in combination with SAS Proc GProject's new from= and to= options to convert the projected coordinates into unprojected (EPSG:4326) long/lat values (essentially 'deprojecting' their map):
proc gproject data=robsdata.umstead_area out=robsdata.umstead_area
from="EPSG:2264" to="EPSG:4326";
id pin_num;
run;
The map dataset contains 1 observation for each x/y point along the border of each map parcel. I used Proc Sql to create another dataset (umstead_area_data) that just contained 1 observation for each parcel, with all the owner/size/value information for each parcel, using the following code:
data umstead_area_data; set umstead_area (drop = x y segment);
run;
proc sql noprint;
create table robsdata.umstead_area_data as
select unique *
from umstead_area_data;
quit; run;
Next, I used the following code to subset just the parcels I was interested in, and set up the HTML mouse-over text and drill-downs:
data mydata; set robsdata.umstead_area_data;
length my_html $500 colorval $50;
if index(propdesc,"WILLIAM UMSTEAD STATE PARK")^=0 then colorval="Umstead Park";
if pin_num in ('0776275726' '0775364221' '0775542715' '0767993962' '0768914024'
'0778007683' '0777452678' '0777344265' '0777424290' '0777700300' '0777704352'
'0785187931' '0785187931') then colorval="Umstead Park";
if index(propdesc,"RALEIGH-DURHAM INTN'L AIRPORT")^=0 then colorval="Airport";
if index(propdesc,"PROP OF RALEIGH DURHAM AIRPORT")^=0 then colorval="Airport";
if index(owner,"AIRPORT AUTHORITY")^=0 then colorval="Airport";
if index(owner,"WAKE STONE CORPORATION")^=0 and index(propdesc,"YOUNG LAND")^=0 then colorval="Quarry";
if index(owner,"SAS INSTITUTE INC")^=0 then colorval="SAS";
if index(propdesc,"CRABTREE CREEK WATERSHED PROJECT SITE 23")^=0 then colorval="Crabtree Park";
if colorval^='' then do;
my_html='title='||quote(
'Parcel: '||trim(left(pin_num))||'0d'x||
'Owner: '||trim(left(owner))||'0d'x||
'Propdesc: '||trim(left(propdesc)))||
' href='||quote('http://services.wakegov.com/realestate/Account.asp?id='||trim(left(reid)));
output;
end;
run;
Now I can plot the parcels on the map, and color-code them, but I also wanted to show a streetmap behind the parcel polygons, to help put them in context. Rather than the normal/colorful streetmap, I selected a map server that has simple gray scale map tiles, such as this one (opnsta_13_2301_3221.png):
I then knitted the 16 individual tiles together using annotate 'image' commands, to create what appears as a seamless/continuous image in the background. But since the tile-based maps have their own coordinate system, I had to convert my SAS map polygons (for the property parcels) into the same coordinate system as the map tiles, so they will line up properly. I use the following code to do that (adapting equations from openstreetmap.org):
data mymap; set mymap;
lon_rad=(atan(1)/45)*long;
lat_rad=(atan(1)/45)*lat;
n=2**&zoomlvl;
x = ((long + 180) / 360) * n;
y = (1 - (log(tan(lat_rad) + (1/cos(lat_rad))) / constant('pi') )) / 2 * n;
run;
data mymap; set mymap;
y=y*-1;
run;
And for the finishing touch, I annotated labels on the map. Some of the labels were positioned using a percent distance from the bottom/left of the screen, and some were positioned based on lat/long coordinates - of course, the latter had to be converted to the openstreetmap coordinate system before overlaying on the map, so they would line up in the desired locations. Below is the code for the lat/long-based annotated labels & circles:
data anno_circles_labels;
length label_position $1 label_text $100;
infile datalines dlm=',';
input lat long pie_size label_angle label_position label_text;
datalines;
35.8408933,-78.7757316,3.8,70,3,Proposed New Quarry
35.8449202,-78.7947162,2.5,250,d,Proposed Luxury Hotel / Offices
35.8483811,-78.7839606,4.8,90,b,Proposed Parking
;
run;
data anno_circles_labels; set anno_circles_labels;
lon_rad=(atan(1)/45)*long;
lat_rad=(atan(1)/45)*lat;
n=2**&zoomlvl;
x = ((long + 180) / 360) * n;
y = (1 - (log(tan(lat_rad) + (1/cos(lat_rad))) / constant('pi') )) / 2 * n;
run;
data anno_circles_labels; set anno_circles_labels;
y=y*-1;
run;
data anno_circles_labels; set anno_circles_labels;
length function $8 style $35 color $8;
xsys='2'; ysys='2'; hsys='3'; when='a';
/* the circle */
function='pie'; width=2; style='pempty'; rotate=360; color='blue';
size=pie_size; output;
/* the label outside the circle */
function='pie'; style='pempty'; line=0; size=size*1.1; angle=label_angle; rotate=0; output;
function='piexy'; size=1; output;
function='cntl2txt'; output;
function='label'; style=''; angle=0; rotate=0; size=.; x=.; y=.; color='blue'; size=1.6;
position=label_position;
text=trim(left(label_text));
output;
run;
I bet you wouldn't have thought so much work went on behind-the-scenes to create that map, eh?!? It's not nearly this difficult to create a simple map (such as just a plain-old choropleth map), but when you want a map that the software wasn't originally set up to create, it's great to have the flexibility to write code to do whatever you want!
It will be interesting to see how this land is eventually used. What would be your preference, and how do you think the land will actually be used? (feel free to leave a comment)

4 Comments
Nice analysis! That could be any of us on a typical Saturday. As The Triangle grows, it is important to protect our greenspace.
Robert: Great practical application. Thanks for sharing. The actual boundaries of William B. Umstead State Park are larger than your map indicates. It is complicated since there are multiple PINS that make up the Park (shown in green in IMPAS). The PIN tracts that make up Umstead State Park: 0776275726, 0775364221, 0775542715, 0767993962, 0768914024, 0778007683, 0777452678, 0777344265, 0777424290, 0777700300, 0777704352, 0785187931, 0785187931.
Ahh - thanks for the info! I'll see if I can include those PINs in my map!
OK - I've updated my map now, so it includes all property parcels with those PINs! :)