The U.S. was really fortunate in having the recent total solar eclipse pass through so many of its states! This gave lots of people an opportunity to see it, with just a short (or moderate) drive. I think a little kid spoke for all of us when they said "Let's do that again, mommy!" In this blog post, I map out all the total solar eclipses around the world, until the year 2030, to show you when and where they'll be happening...
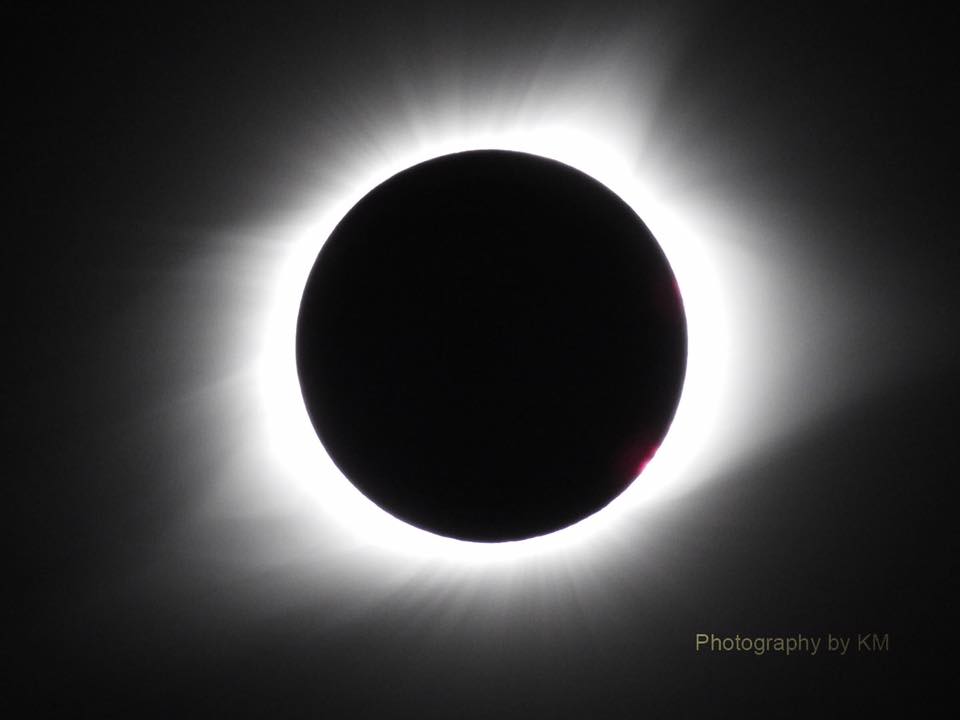
But before we get started, here's an awesome photo of the recent eclipse my co-worker Karen M. Allen made. This looks like something out of National Geographic, eh!?!
Now, let's find out where & when those future total solar eclipses will be!
For the 2017 eclipse, NASA provided a download page containing the Esri shapefile of the polygon for the total eclipse area. That was really convenient for plotting it on a map ... but I couldn't find shapefiles for the other eclipses. I did find some data pages (2011-2020, and 2021-2030), with a lot of text, and a table of text coordinates for each eclipse. Here's a screen-capture showing the table portion of the 2017 eclipse page:
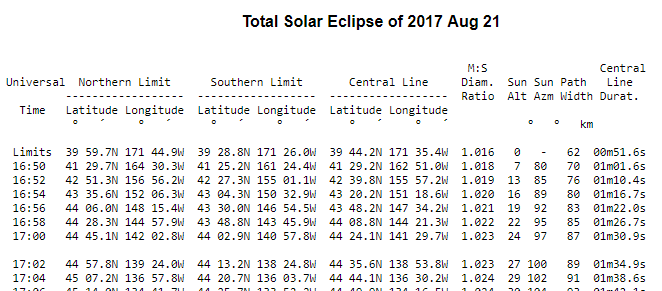
It's often difficult to read data out of a text report, so I took a brute-force approach. I determined exactly which columns the lat/long data values were in, and I tried reading them from every line of data. If I succeeded in reading all the lat/long coordinates from a line, then I kept it in my dataset - otherwise I just discard it as a non-data line. I like "letting the machine do the work" like this, when possible!
Next, I had to decide how to visually represent the data. A polygon is probably the optimal visualization, but it would be a bit tricky splitting the polygons in places where they cross from the left to the right side of the map, etc. Therefore I decided to use a simple line, connecting the 'Northern Limit' and 'Southern Limit' coordinates, at each 2-minute time interval. This was very easy to program, and I think the results look pretty nice. Also, when you see a diagonal line, that's a visual cue that the shadow would be more of an ellipse than a circle at that point (this is something that the polygon wouldn't tell you!).
I annotated year labels on both ends of each eclipse path, and also used annotate to add a title and color legend (annotating the title text lets me place it 'inside' the map area, whereas using the traditional title statements would have limited the title to positions outside the map area). I also added drilldown links to the year labels and legend, so you can click them and see the actual NASA data when you view the interactive version of the map.
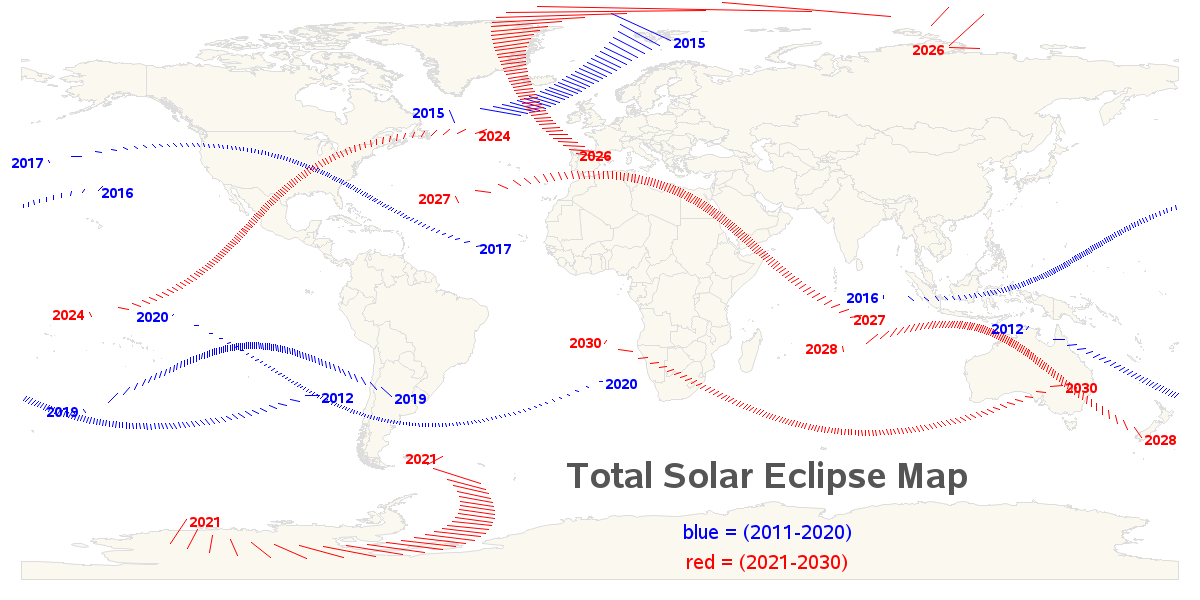
Here in the U.S., the next total solar eclipse is in 2024 (about 7 years from now). And if we want to go to South America, we can see one in 2019 (just 2 years away). When's the next total solar eclipse coming close to your country? How far would you travel to see an eclipse?


7 Comments
The 2017 and 2024 eclipses seem to cross each other somewhere across Missouri (?), is there a way to know where?
If I had the polygons for the eclipse areas, I could find the cities that are 'inside' them (using Proc Ginside), and then look for which cities are inside *both* of them (using a Proc SQL join, for example).
Beautiful! You can easily see the area in the US that will see the eclipse twice, and also realize that very few people will see the 2021 eclipse.
Yeah Tricia! We'd have an ecliptic adventure! :-))))
Can you add filters for available hotels? Yes I need star ratings with it!
Who knows ... maybe I'll be at Michelle's house.
Love how you turn data into visual eye candy! Nice interactivity too.
Sydney for me in 2028!!! Only 1000km to travel. Who wants to join me???
Neat map!
After the incredible experience that folks seemed to have with #Eclipse2017, I've heard some people say they are willing to travel pretty far!