My previous blog post focused on a graph, showing the % of women earning STEM degrees in various fields. While that graph was was designed to answer a very specific question, let's now look at the data from a broader perspective. Let's look at the total number of STEM degrees per year in various fields, for men and women!
When I post graphs, they often promote a lot of discussion (in the blog comments, private emails, etc). One of my readers suggested that I might want to limit the previous graph to just the years since the STEM program started, to show the results of the STEM more clearly - or as he put it "or in this case lack of results."
Agh! - I was sort of taken aback that he interpreted my graph as showing there was a lack of results from STEM! True, the percent of women versus men getting STEM degrees has been fairly flat the past 5 years, but that doesn't mean the number of women getting STEM degrees has been flat - those numbers have actually had pretty good increases. But since the increase has been for both men and women, the percent women/men graphs of course appear fairly flat. So, let's take a deeper dive, with another graph...
Women in STEM
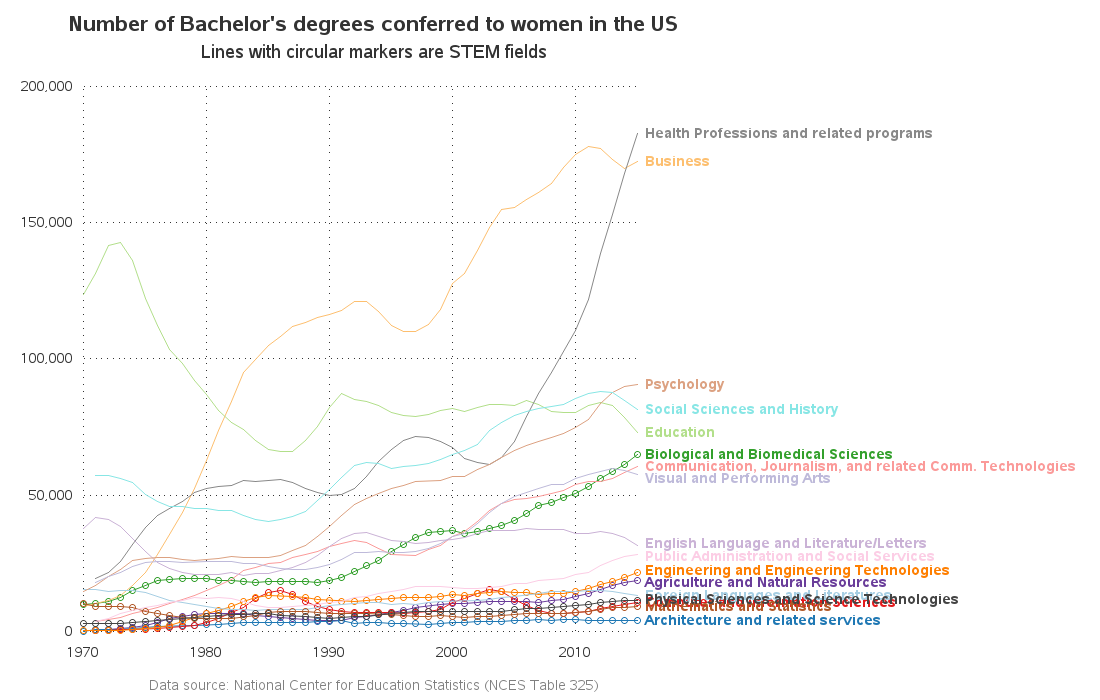
I always recommend looking at data in several different ways to get a more complete understanding, so let's now look at the number of degrees rather than the percent that went to women. The biggest feature in this graph is the increase in the number of women getting Business degrees and degrees in Health Professions and related programs. (Note that the Health degrees are also considered STEM by some, and there's a lot of technology there).
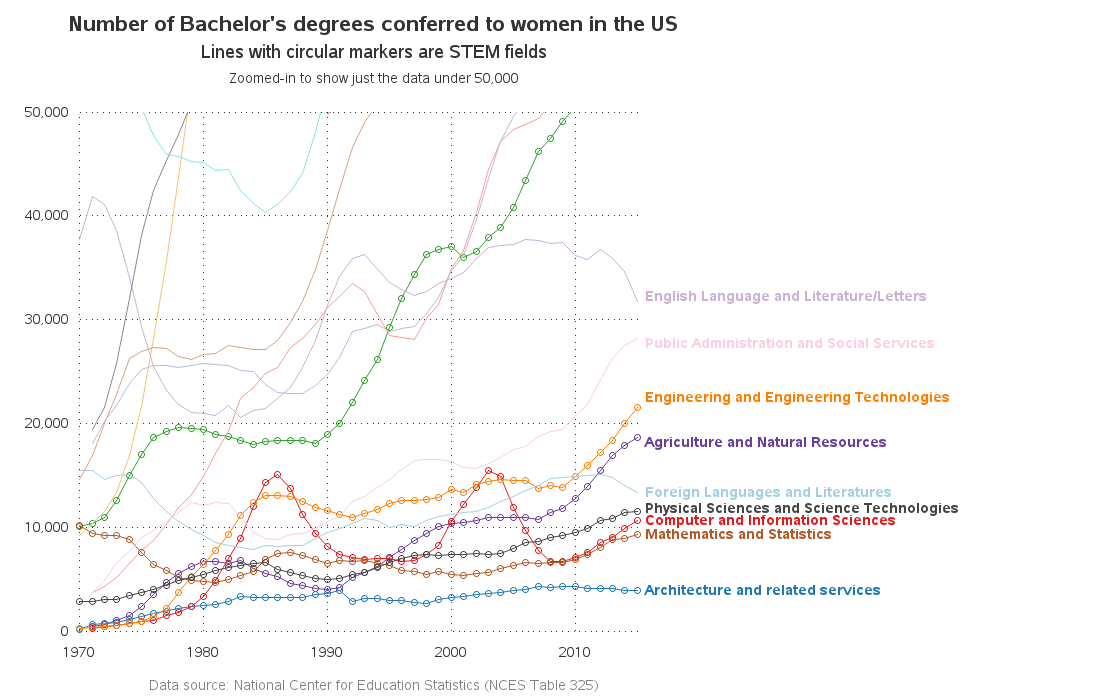
But let's eliminate those tallest lines, and focus on the bottom 1/4 of the graph where the classic STEM degrees are located (the lines with the circular markers). Now you can see more clearly that most of these STEM lines generally have had a pretty nice increase in the last 5 years! :-)
Men in STEM
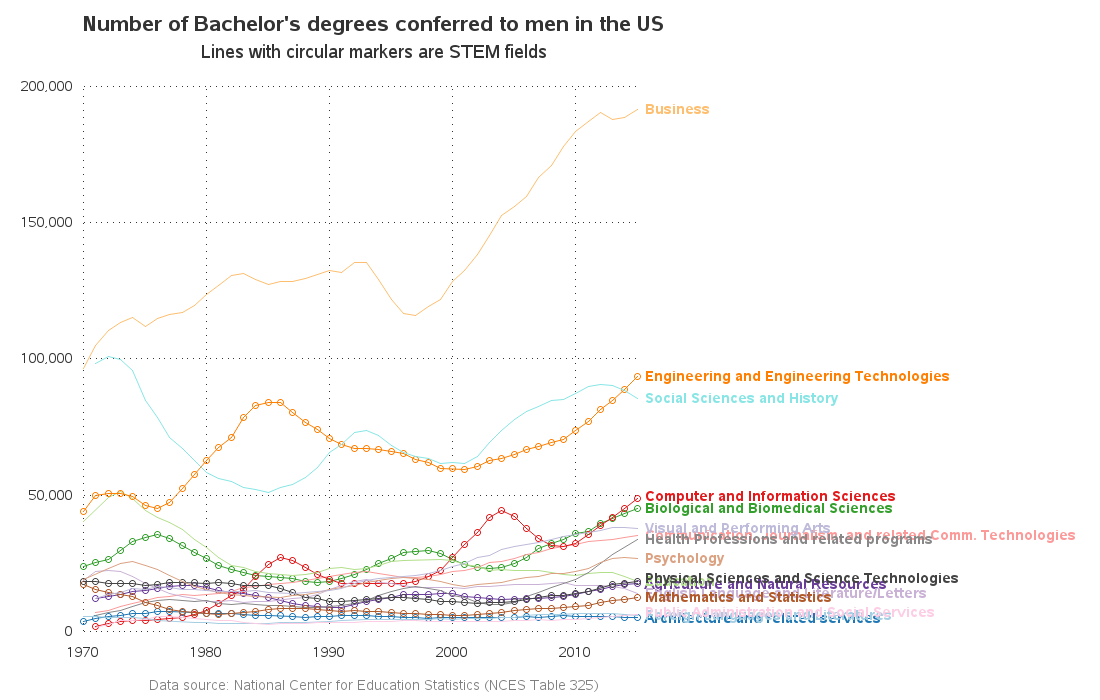
And what about the men? Looks like there's been the same huge increase in the number of Business degrees (dominating the top 1/2 of the graph). And a fairly high number of Engineering degrees (although it's a distant 2nd to the Business degrees).
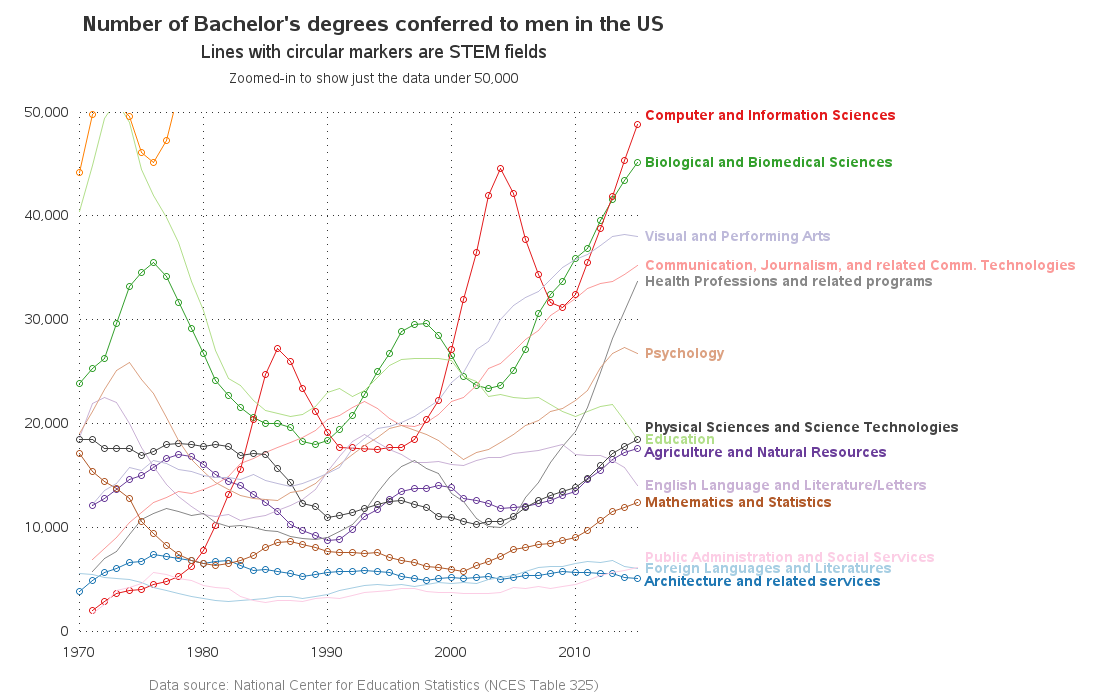
When we zoom-in and focus on the bottom 1/4 of the graph, we can get a better look at the majority of the STEM fields. Looks like there were big increases in Computer Science and Bio degrees. And although not always considered part of STEM, there has been a big increase in Health Professions degrees.
So, there does appear to be a pretty solid increase in the number of people getting STEM degrees lately. Was this increase because of the STEM program, or other factors such as supply-and-demand, job availability, parental advice, salary incentives, and TV/movie glamorization could all play a role? I'm thinking it was most likely a combination.
Question
My big question ... why the huge increase in the number of Business degrees? I got my bachelor's degree at NCSU (in the 1980s), which was known for having more of a science & engineering focus, rather than liberal arts & business. Their science & engineering programs required more difficult calculus, physics, and chemistry classes, and people who couldn't pass them typically transferred into business programs (which required less difficult classes). So, I wonder if maybe lots of students are being recruited into STEM programs, having difficulty passing the classes, and then end up transferring into business programs(?) Just a theory! ... Feel free to share your insight and alternate theories in the comments.

4 Comments
Have you thought about using an alluvial plot?
Hmm ... might be interesting. Give it a shot, and post up what you get so we can see! :)
You have tackled a challenging graphic problem: how to get distinguishability and identity of plot lines and, if used, non-colliding curve labels when you have too many plot lines. It looks like you have used transparent colors for the non-STEM degrees, to highlight the non-transparent-colored STEM degrees. The zoomed versions of the two plots DO remove the collisions between STEM degree curve labels, but at the expense of losing most of the plot line for the most popular STEM degree in each case (FEMALE & MALE). Why did you decide NOT to use a legend instead of curve labels? Of course, if you had used a legend, the identity of the thin non-STEM plot lines would have been a mystery in many, if not most, cases. As you know, elsewhere I have emphasized the importance of thick colored lines, large color plot markers, large legend color samples (if squares or rectangles), and thickly drawn (i.e., bold) colored text--IF you want to successfully communicate with color. (See, for example, http://nebsug.org/wp-content/uploads/2016/05/2016-Bessler-Paper-IASUG-NebSUG-2016-Paint-a-Better-Picture-of-Your-Information-with-Color.pdf ) If you experimented with thick plot lines for the non-STEM degrees, how did the graph look?
I haven't tried the plot with thicker plot lines, but that might be worth experimenting with.