For the past several years, efforts have been under way to recruit more women into the STEM (science, technology, engineering, and math) fields. I recently saw an interesting graph showing the percentage of bachelor's degrees conferred to women in the US, and I wondered if I could tweak that graph a bit to focus on the STEM majors.
But before we get started on the technical graphs, here's a fun 'graduation' photo... This is a picture of my friend Margie, graduating from Hurricanes U. She's a huge Carolina Hurricanes hockey fan, and has earned the nickname "Clever Sign Chick" for the signs she holds up during the games. So, of course, when the Hurricanes offered a special training camp, she was head of the class!
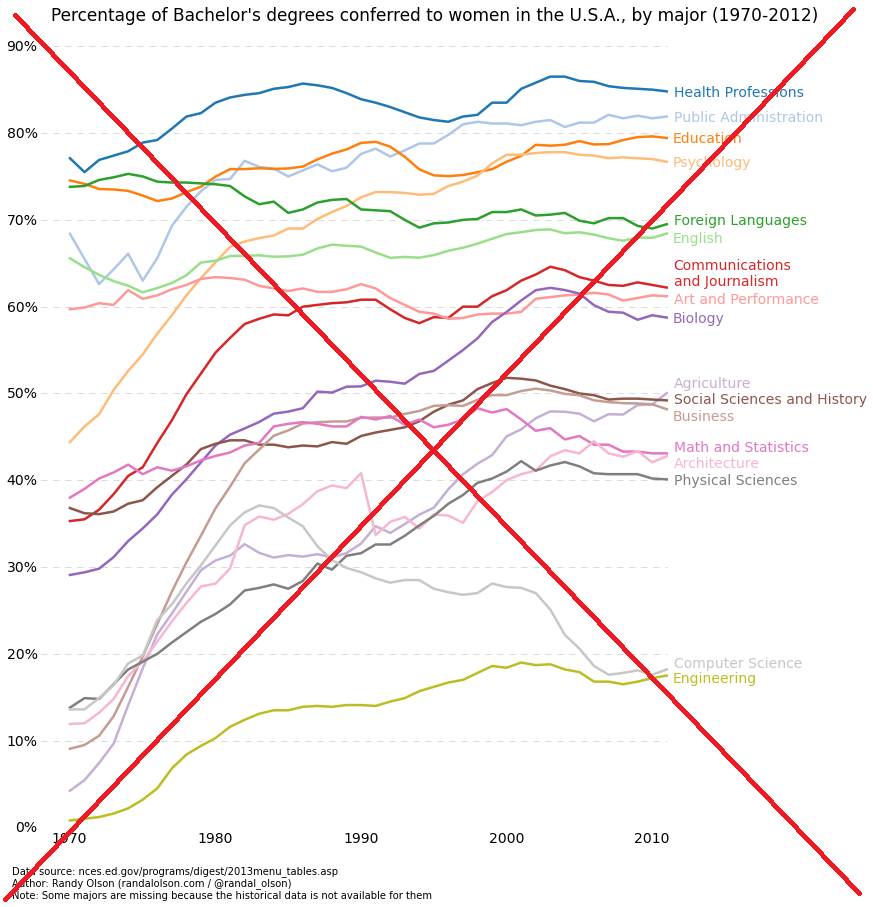
And now, let's get technical ... Here's a snapshot of Randy Olson's original graph. It's difficult to show so many lines on a graph without it looking like spaghetti, but I think he did a pretty good job. In particular, I like how each line is labeled, and the colors of the labels match the colors of the lines (eliminating the need for a color legend).
Randy showed the data source URL in a footnote, but it still took a bit of digging to determine exactly which table(s) on the NCES (National Center for Education Statistics) website he had used. I finally determined that the data was in the '325.x' tables, and I downloaded the Excel spreadsheets and wrote some SAS code to import them (... 17 separate tables, which each had the data in slightly different ranges of cells). The basic plot was easy, but the tricky part was annotating the text labels for each line, making the label colors match the line colors, and adjusting the y-position of the labels so they didn't overlap.
And here's my new version of the plot:
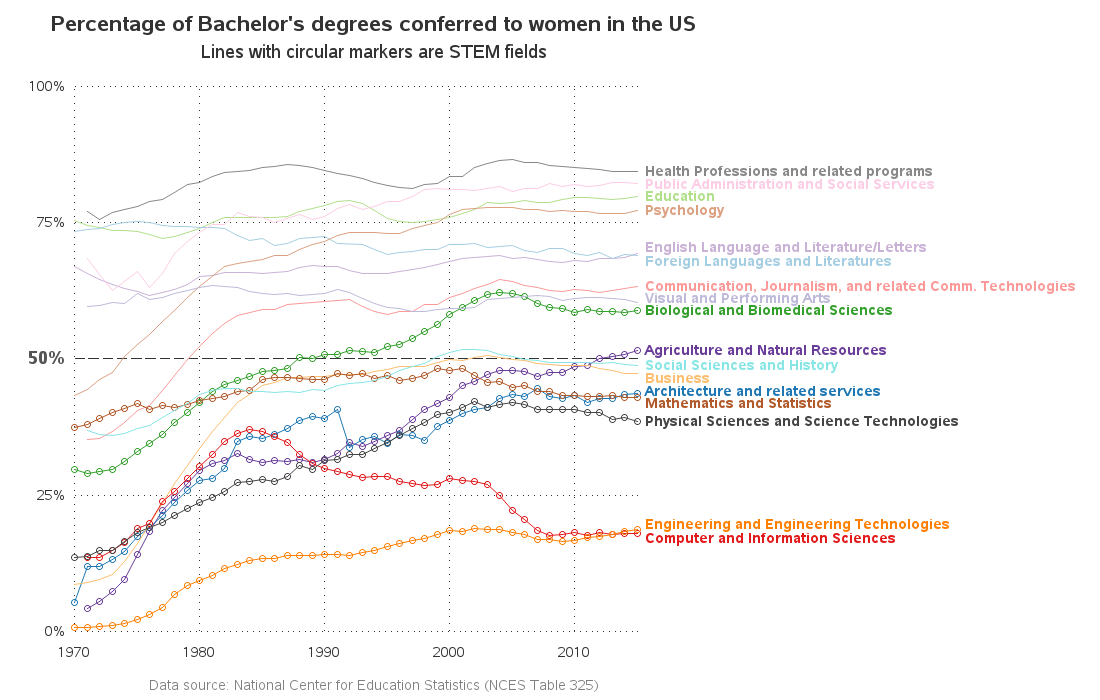
Here's a list of the changes I made:
- I wanted to emphasize the STEM fields, therefore I used darker colors for those lines, and lighter colors for the other lines.
- To make the STEM lines even easier to identify, I also added plot markers to those lines.
- I made my axis go to 100%, rather than just 90%.
- I made the 50% reference line darker & bolder, since that's the important balance point.
- I mention in the footnote exactly which set of NCES tables the data came from.
- I used the full descriptive text from the tables as the line labels, rather than shortening the text (the shortened names in the original graph could be a little misleading - for example, I used "Public Administration and Social Services" rather than just "Public Administration").
- And I got the latest data, so I was able to extend the graph out to 2015 (instead of just 2010).
Were there any surprises or insights you were able to derive from this graph? The biggest surprise for me was the "Computer and Information Sciences" line - I assumed that the percentage of women in this field had been increasing, but apparently it peaked in the mid-1980s and has decreased by about 50% since then.
Feel free to leave a comment with your own observations, insights, questions pertaining to the graph, and women in STEM fields!
Update: I've written another blog post, with a deeper dive into this data!


10 Comments
Hello Robert, My daughter graduated from NC State University 3 years ago and now she is a manager. Her STEM degree was the best career decision she ever made. We should support more younger girls to pursue a career in STEM.
Glad to hear of yet another successful NC State graduate in a STEM field! :)
I read in an article somewhere about one theory for that drop in the 80s was the rise of gaming consoles. Once they were being put in major stores outside Radio Shack, they had to "pick a gender" to market to in the actual store. That gave way to commercials starring exclusively boys. It was subtle in the relation to career choices but I could see that. I grew up through all that somehow unaffected but I was one of a handful of girls graduating in computer engineering in 2005. Cut that number even more for non-international students. I got lucky to be the daughter of an engineer so I saw it in my house...other girls just didn't get the exposure to technology...therefore they weren't looking to partake. Anyways, that's my 2 cents. :)
Ah ha! Found it! http://www.npr.org/sections/money/2016/07/22/487069271/episode-576-when-women-stopped-coding
Ahh! - Interesting!
The movie HIDDEN FIGURES showed how 1) women were 'computers' for the men who were engineers. 2) some women went on to study engineering and 3) some women who were 'computers' learned computer languages like Fortran and led other women who did mainframe operations and data entry. So the start of the computing age opened up a new opportunity for women, first in the government and military, then in large companies like the old AT&T. But the emphasis was on supporting another activity whether engineering or business operations. So computing was automating what women did before by hand. And many young women saw their mothers advancing in IT and went on to study computer science.
Computing was not considered engineering till the 1980s although some departments did sit in engineering schools as a support function. With the emergence of gaming culture, PC software and then the spread of the internet, it seems that the geek stereotype and mentality alienated women on campuses and in the business world. Also the domination by Microsoft in the 1990s removed many of the roles women had in supporting other technologies. It is interesting to note that the drop in the percentage of women did not occur in math or engineering.
When I started working in this field (in 1970, the year your graph starts) I worked with a lot of women. Almost 50% of my coworkers were women (including my direct manager).
I think that the number of women actually working in the field was not very closely related to the number of CS graduates yet because many schools (including the one I attended) did not yet offer a CS degree. The closest thing you could get was a degree in math with a minor in CS. Very few of my coworkers at that time (either male or female) had CS degrees.
I think that one of the reasons for the drop in the 1980s was the marketing for personal computers, which was aimed entirely at men and boys. The male-dominated marketing tended to turn off many girls that might otherwise have gone into CS. The ones who were still committed to a STEM education tended to go into other fields, which probably explains at least part of the increases in most of the other STEM-related lines during that time period in the graph.
Ahh! - Interesting details, and that could certainly explain the first decade or so of the CS data!
In recent years, NCSU moved CS from the "Physical & Mathematical Sciences" to "Engineering" - I wonder if changes like that are also steering it towards the same Male/Female split as Engineering? I also suspect that popular movies & TV shows have a lot to do with which majors males & females pick.
In 2006 when my oldest son was a junior in high school, we visited a lot of universities. At every school we asked what percentage of students in Computer Science were women. At every school, we were told the same answer: 10% (which is actually lower than what your numbers show so it seems that the few women who were there weren't getting credit). Those schools included Stanford, University of Southern CA, Harvey Mudd, Cal Tech, UC San Diego, UC Berkely, UC Davis, UC Santa Cruz, UC Santa Barbara, and UC Riverside--in other words, a pretty broad spectrum. We were told (as you concluded from your graph) that the percentage of women in Computer Science had declined, especially after the dot.com bubble burst in the early 2000s.
Your graph goes up to 2015--which is pretty recent--but there is some evidence that there has been a sudden shift since then. Of the bachelor's degrees awarded by Stanford's Computer Science department last month, 30% were to women! I think it is not a coincidence that Stanford hosted a one-day Women in Data conference in 2015. What we are seeing here is that a little encouragement goes a long way. If you update this chart in a few years, you may see a sharp rise.
Thanks for the extra info!