SAS provides a map for each country, but there are likely other maps you want to use that SAS does not provide. If you have other maps in the Esri shapefile format, you're in luck - you can import those maps and use them! In this blog post I share my fourth tip on mapping tools available in SAS - the basics of importing maps, using Proc MapImport.
But before we get started, here's a picture that might give a hint as to which map I'm going to use as my example... My mailbox & post was over 25 years old, so I finally decided to replace them. Since I order a lot of things online, I decided to get a slightly over-sized mailbox (which has turned out to be really handy). So, with this hint, can you guess which map I'm going to show how to import?...
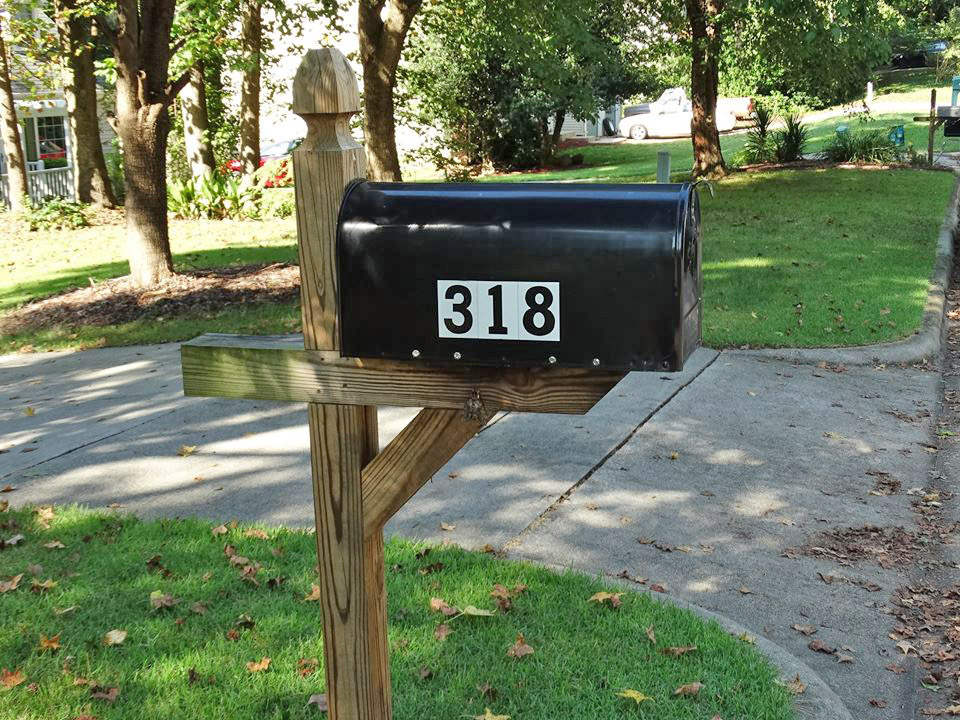
I bet you already guessed it ... I'm going to show how to import a zip code map, or more precisely, a zip code tabulation area (ZCTA) map.
Here in the US, the government creates ZCTA boundary maps, and allows you to download them free of charge on the census website. I downloaded the 2016 map on my PC, and used Winzip to unzip it into my D:\Public\Census_2016\ folder.
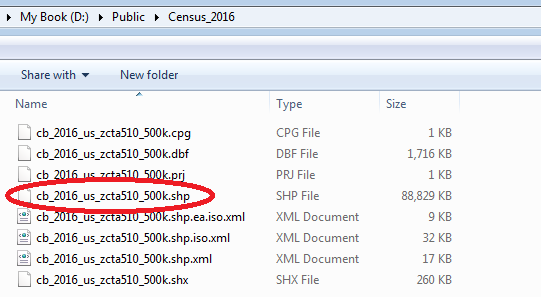
The syntax of Proc MapImport is very simple - you basically tell it where the shapefile is, and where to store the imported dataset. Note that although you only specify the .shp file to Proc MapImport, the other files associated with the shapefile are expected to be in the same folder.
proc mapimport datafile="D://Public/Census_2016/cb_2016_us_zcta510_500k.shp" out=my_map;
run;
But there's one more step required to guarantee that the imported map is good & proper. You need to specify an ID variable. So importing is really a two-step process ... 1) Import the shapefile so you can look at the variable names and choose an ID variable, and 2) Import the shapefile again, specifying the ID variable.
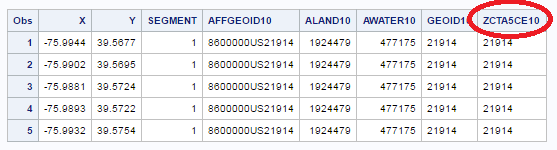
Here's a Proc Print of the imported data. This is a ZCTA map, and we're going to be plotting data on it by 5-digit zip code, therefore we're looking for a column that has values like that. I decided to try ZCTA5CE10, and it seemed to work pretty well. (You might have to use some trial-and-error with your maps.)
Now, run the Proc MapImport again, using the ID variable:
proc mapimport datafile="D://Public/Census_2016/cb_2016_us_zcta510_500k.shp" out=my_map;
id ZCTA5CE10;
run;
The imported map contains the entire US ... which is a bit visually overwhelming for data analysis at the zip code level. Therefore you'll probably want to subset the data by state (or maybe city, or a list of zip codes). The dataset doesn't have a state variable, but we can calculate that from the zip code, using the zipstate() function. Here's how I subset it for North Carolina (NC):
data my_map; set my_map (where=(zipstate(ZCTA5CE10)='NC'));
run;
And now, we can plot the North Carolina zip code map. That means we're done ... right?
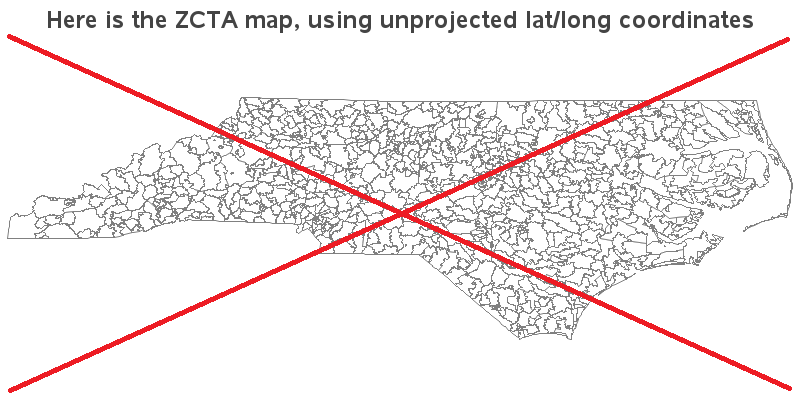
As you might have noticed in my previous blogs, I tend to put a big red 'X' on bad graphs (to make sure people don't mistake them for good graphs) ... and this map has a red X. You might be wondering what is bad about it? Well, the X & Y variables in this particular map dataset are unprojected longitude & latitude values, and therefore this map will look a bit 'squished' to most people, because they are used to seeing projected maps. Therefore, let's use Proc GProject, as I demonstrated in a recent blog post.
proc gproject data=my_map out=my_map eastlong degrees;
id ZCTA5CE10;
run;
Now when you draw the map (using the same Proc GMap code as above), you get a North Carolina zip code map that's not squished looking:
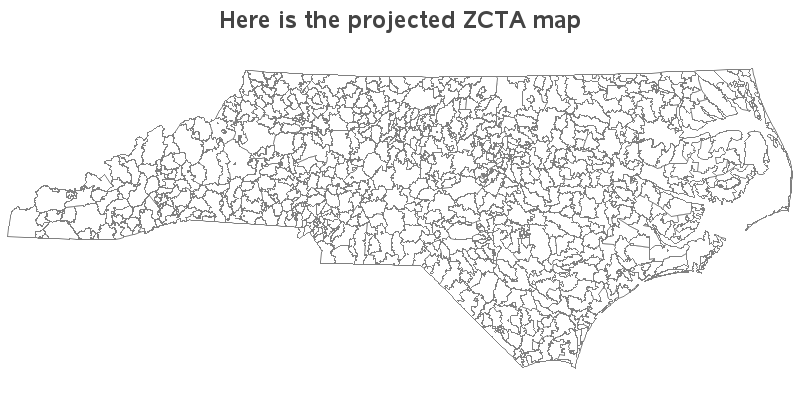
You're probably thinking we're done now, right? ... Right?!? Well, not quite. I was a little sneaky, and used a white fill color for the maps above. By using a white fill, you can't really tell whether all the things that look like ZCTA polygon areas are truly areas, or just a section of white background that happens to be surrounded by other ZCTA polygons. So let's plot it one more time - this time with a fill color other than white:
pattern1 v=s color=bisque;
proc gmap map=my_map data=my_map;
id ZCTA5CE10;
choro segment / levels=1 nolegend coutline=gray;
run;
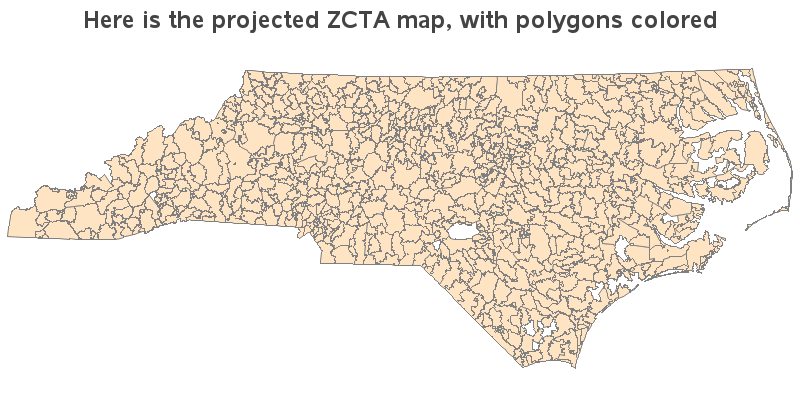
You can now see that there are a few white 'gaps' in the map - areas that don't have a ZCTA polygon. This is not a problem per se, but just something you need to be aware of. I suspect that the large gap in the bottom/middle of the map is probably Fort Bragg (a military base). Other gaps could be parks, forests, swamps, or other areas where people don't live (and therefore don't need mail delivery).
Although this example used zip code maps, the process is very similar for any Esri shapefile. Now, armed with one more tool in your mapping toolkit, what maps are you planning to import into SAS?!?
Click here to see all my tips about mapping tools!


4 Comments
Hi. This is another in a great series of "how to" mapping postings. If anyone wants some additional reading on map import where census tracts and county subdivisions are used (in Maine, not North Carolina), take a look at ...
From Shapefiles to Maps Via PROC MAPIMPORT and PROC GMAP
http://www.lexjansen.com/nesug/nesug11/gr/gr11.pdf
Thanks Mike!
I'm glad to see the Outer Banks made the map. Barbara Okerson did a presentation at SESUG last year where she was talking about how it is frequently omitted.
Hope you like your new mailbox.
Ahh yes! - I saw Barbara's excellent presentation!
I'm really liking the new mailbox. But ironically, whereas my old mailbox never had a problem for 25+ years, about a month after I put up the new one, my across-the-street neighbor hit it while backing out of his driveway! smh...