Like many words, if you just say "Cat 5" different people might think you're talking about different things. Computer geeks might assume you're talking about category 5 network cabling. But around this time of the year, most people in the southeast US will probably assume you're talking about a category 5 hurricane ... and that's the topic of my blog post ...
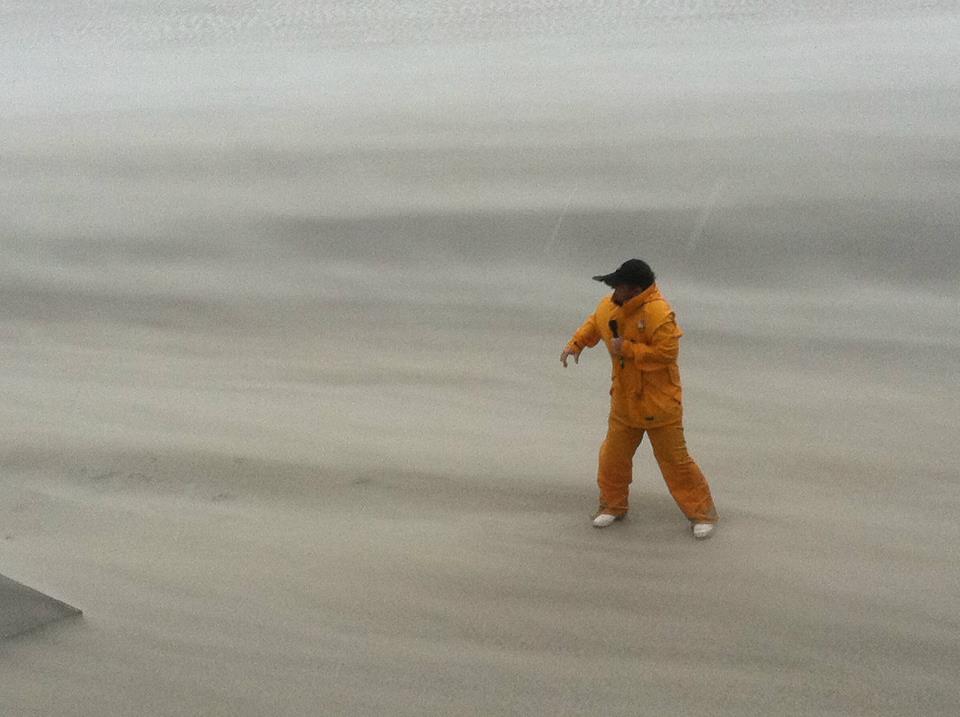
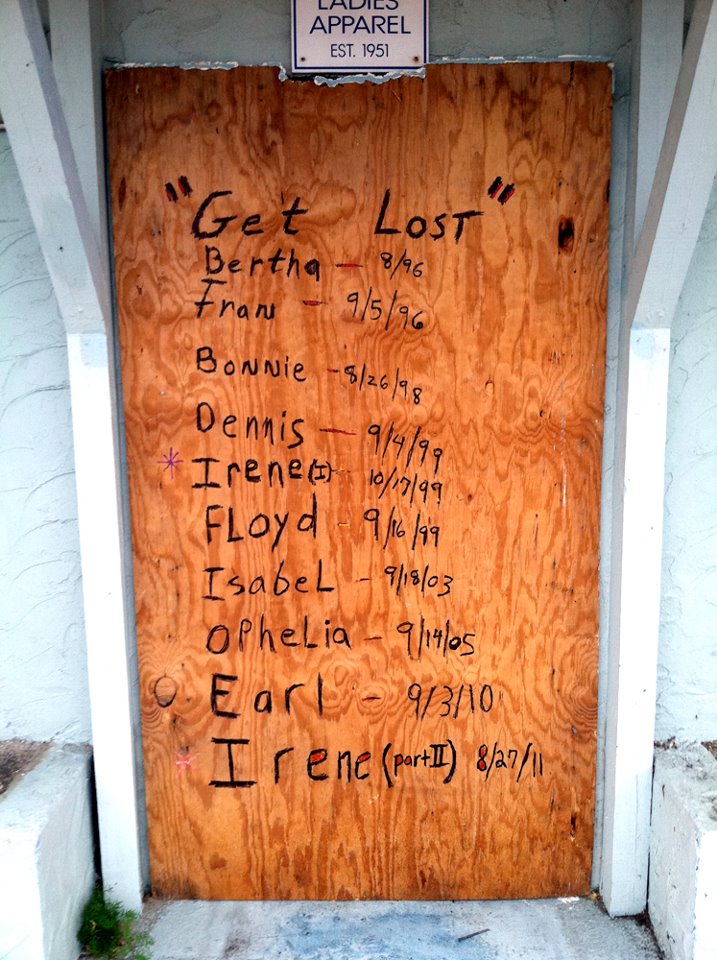
Before we get started, here are a couple of hurricane-related photos to get you into the right mindset. These photos are both provided by my blog editor Maggie, from the last NC hurricane she covered as a news reporter. The first one is a picture of a brave (or is that crazy?) NBC reporter, and the second one shows how some of our coastal locals feel about hurricanes.
This past weekend, while I was at Lake James enjoying great weather and racing dragon boats, Hurricane Matthew grew to a category 5 storm, which means its winds were 157 mph or higher. It is still located south of Cuba, but is forecast to probably start heading north, and could affect many states in the southeastern US (including North Carolina).
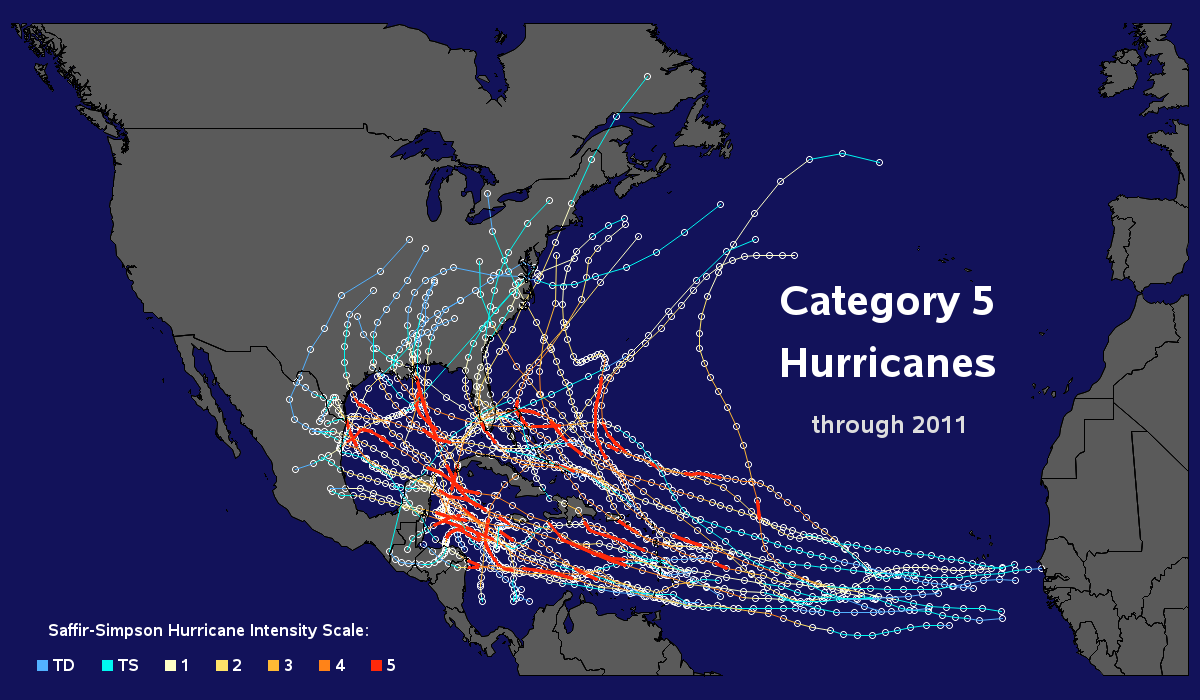
Being a data-guy, I got to wondering how many other category 5 hurricanes we've had in the Atlantic, and what paths they took. So I dusted off my SAS code that reads the ascii hurricane database from the Unisys website and plots them all on a world map, and recycled it to focus on just the hurricanes in the Atlantic.
First, I used Proc Gproject to clip out just the area of interest from the world map.
Next, I plotted the paths of all the hurricanes that had reached category 5 speed (157 mph) using annotated colored line segments. I then added some text in custom locations for my titles & legend (using note statements). You'll probably need to click the image and view at full size to see the detail of the lines.
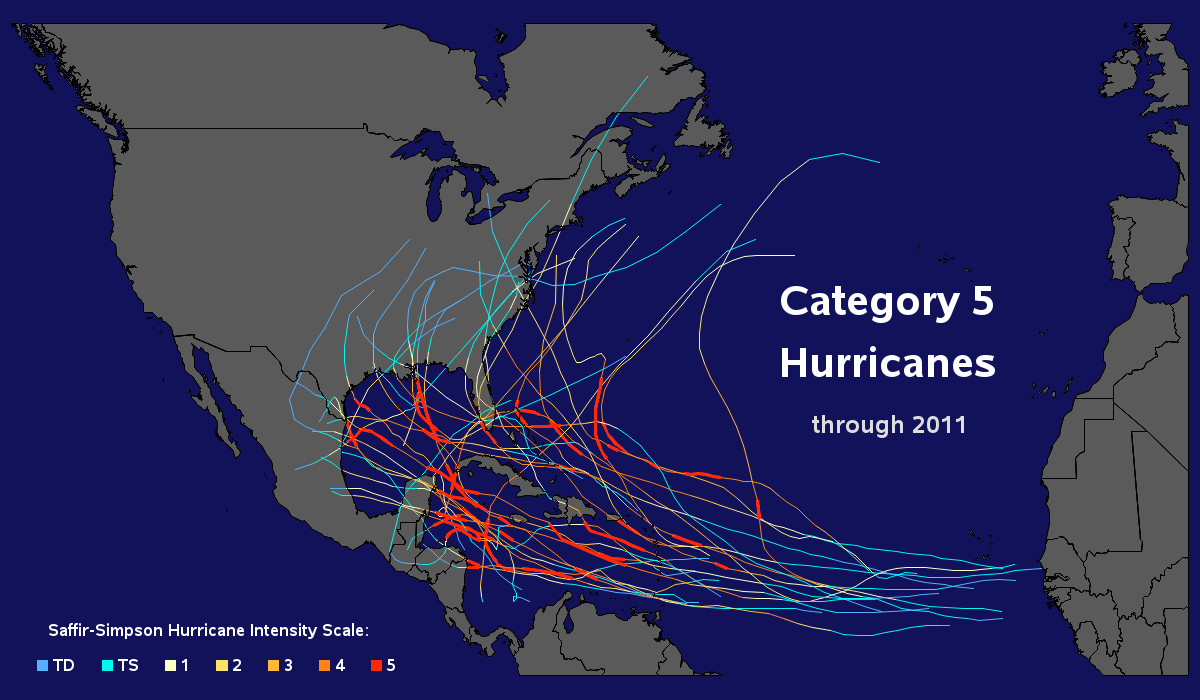
This was the exact map I wanted, but it didn't tell me very much about all those lines - what were the hurricane names, and when did they occur? The map was way too crowded to add labels for each line ... and line segments don't support html hover-text. So I came up with a kludge.
I annotated circles (empty pies) at each point along the lines (see image below), and added html hover-text for the circles. I then re-ordered my layers to have the circles drawn before (behind) the other layers, so they would not be visible - but their html hover-text would still work through the layers. Now, in essence, I've got lines with hover-text. Click the image below to try the final interactive map with invisible bubbles.
Have you ever experienced a category 5 hurricane? (if so, which one?) And what's your prediction for the path of Hurricane Matthew?

2 Comments
Clicking on the final map, the table of the plotted hurricanes are shown, with maximum speed. But why is maximum speed only measured in steps of 6 (5 on one occasion)?
The values are 161 - 167 - 173 - 178 - 184 - 190.
I am not able to decipher the raw data on the hurricane database link, but hovering over single
points on the map leads me to suspect the same 5- or 6-points intervals.
There are of course far more serious aspects to hurricanes (which we luckily are spared here in Norway), but this kind of details just make me curious...
The hurricane data is in the master data file as integer "knots", and then I convert that to "miles per hour" and round to an integer. That might have something to do with the value spread you're seeing.