One of my favorite quotes is: "You can't believe everything you read on the Internet" - Abe Lincoln, 1868.
And that is especially true when it comes to graphs and statistics. Hardly a day goes by without me seeing a bad graph that misrepresents the data (either intentionally or unintentionally) . Here is a recent bad example I was surprised to find on Statpedia ...
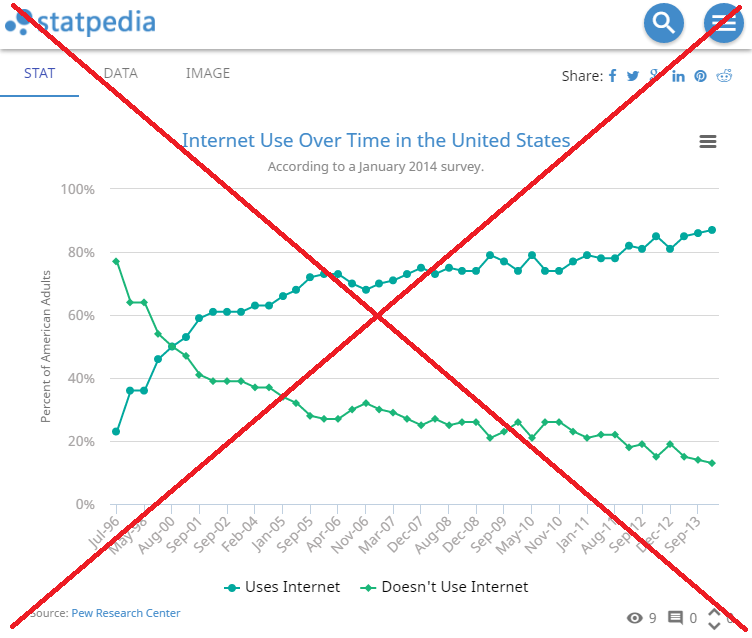
At first glance the graph seemed like a reasonable way to plot the data, but upon closer examination I found a terrible problem that compromises the data integrity! ... They have plotted the survey results all evenly-spaced (probably as character values), even though the surveys were not performed at evenly-spaced date intervals! This seriously misrepresents the data, especially towards the left side of the graph, when the surveys were performed much less frequently (the slope of the line is much steeper than it should be). Also, after examining the source data, I found that they had left out the value for the first/oldest survey.
I followed their link to the original study on the Pew research page, and found that they also created a graph:
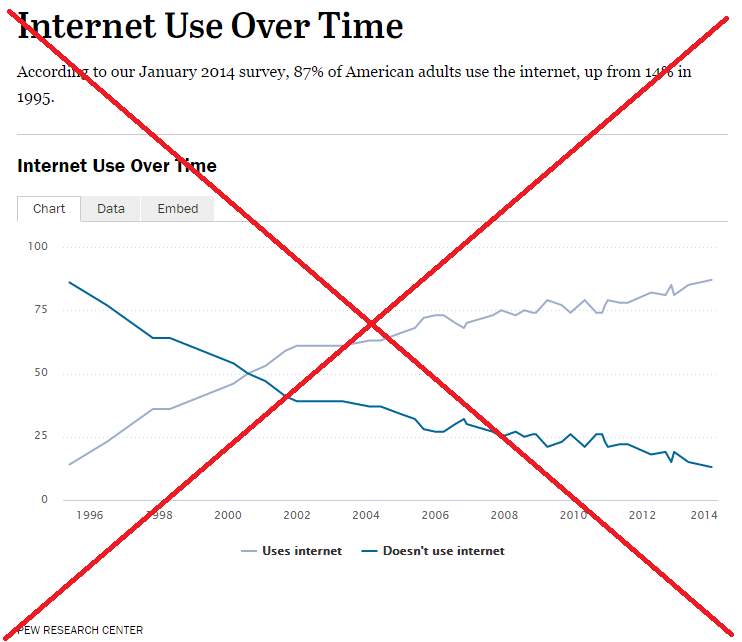
Pew's graph was much better than the Statpedia one - their dates were proportionally spaced, and they included the 1995 survey value. But Pew's graph still wasn't perfect. For example, I would have liked to see a better title that completely described what the data represents. Also, the colors for the two lines were very similar, making them difficult to match up with the legend. And I think it's a little redundant to show both the "uses" and "doesn't use" lines in the graph, since they're always going to be a mirror-image of each other.
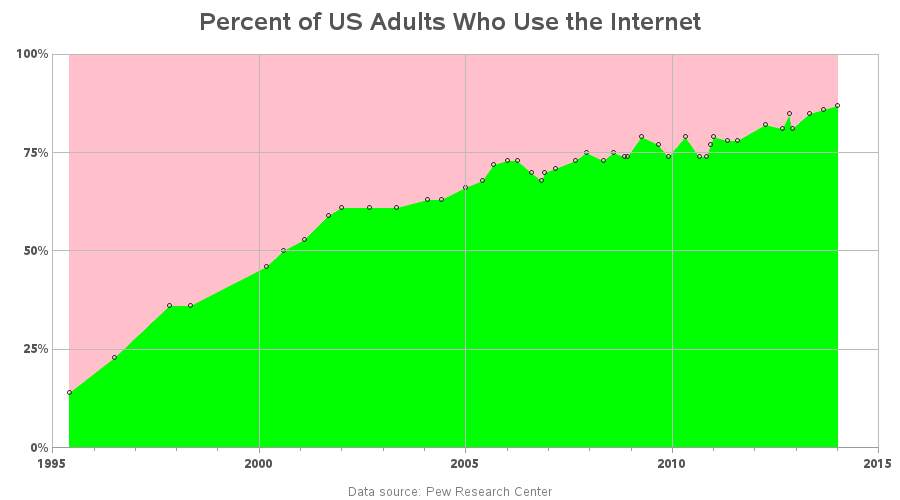
As you might have guessed, I decided to create my own graph, and make a few improvements (click my graph below to see the full size version, with html mouse-over text)...
- My title clearly states that the data is about US adults.
- I only show one line, and let the area above and below the line represent the two values (with the emphasis being on the "uses" rather than the "doesn't use").
- I added reference lines along the date axis, to make it easier to visually estimate when the surveys were performed.
- And I include markers along the plot lines, so you can visually see that the surveys did not occur at evenly-spaced time intervals.
So, apparently the Abe Lincoln quote was right on target (that guy was way ahead of his time!) If you have a favorite quote about statistics or analytics, feel free to share it in a comment.


17 Comments
Hey Robert!
Good catch! I am actually the founder of statpedia (this was not a stat I created, anyone can publish charts on statpedia). I went ahead and remade the chart using the correct scale: http://statpedia.com/stat/Percent_of_Adults_who_Use_the_Internet/SkglBY8_
We are incredibly passionate about the validity of our data and making sure the quality of content is excellent. Chart creation literacy is certainly an important subject which I have had talks with Randy Olson about. This is something we want to pursue more.
Our stacked area chart is currently interpreting "null" values or blank values as zeros, but should be resolved shortly. Perhaps you can comment on your article that statpedia responded and updated the chart. ;)
Ian
Thanks for the update!
And thanks for having the Statpedia website - lots of interesting graphs there!
NP! I would encourage you to publish content on there and use it to embed content on your blog. Every piece of additional content helps.
Very nice to admit imperfection, with grace; then correct promptly. The world is a better place when everyone deals life this way. Bravo!
Former Dutch football (that's soccer over your side of the pond :-)) star Ruud Gullit "We must have had 99 per cent of the match. It was the other 3 per cent that cost us"...........
Nice! (this must be one of those teams that gives 110%) :)
We're getting some real gems here, in the quote section! :)
Robert, I enjoy your blogs. Always. As for the "real gems here, in the quote section"...
Best Answer: It is a joking way of making a serious point. The Internet is full of idiotic "quote websites" that attribute quotes to the wrong person, or just make up quotes and attribute them to some random famous person who never said them.
This Lincoln "quote" is a deliberately absurd example of this. It's a warning to you not to believe everything you read, whether on the internet, or in a book, or anywhere else; you have to use your critical-thinking facility.
What!?! - you mean that quote wasn't real?!? ;-)
I truly do not know. I wanted to believe it is true, but I am not sure. The stuff I pasted yesterday said it is untrue. A guy claiming with Ph.D. in American History said the quote was from A. Lincoln.
Well, the spirit is true: Do not believe anything found on the web.
Just the same: I cannot find any original source material that is definitely by Lincoln which includes the quote you have found! I do have complete Lincoln works, but I am at a loss to locate where this quote might come from.
Well, the spirit is true: Do not believe EVERYthing found on the web.
I guess we can just say it is "true enough"! :)
" If statistics are boring then you've got the wrong numbers"
I suspect that the first time series chart was plotted using MS Excel and a series of data values in consecutive cells: the Excel default is to assume that the values are recorded at equal intervals.
The same problem occurs when a regression curve is fitted to the data using the default method.
An interesting perspective is revealed when a computer program uses R-squared to evaluate the strength of a linear relationship between two variables and no graph is used by the analyst to verify the numerical output.
Interesting theory - If I was a betting man, I'd probably bet money that you're right!
My favorite stats quote: "It's easy to lie with statistics, but it's easier to lie without them." -- Fred Mosteller.
Hmm ... I'd never thought of it this way, but that does seem to be true!