With recent advances in quadcopters, or drones, they have become pretty capable and fun flying machines. And just about anybody can afford the entry-level models. They've recently become prevalent enough that the government has started coming up with rules, and the Federal Aviation Administration (FAA) started requiring owners to register drones that are over .55 pounds. The FAA recently released their drone registration database (down to the zipcode level), so of course I thought it might be interesting to plot the data on a map!
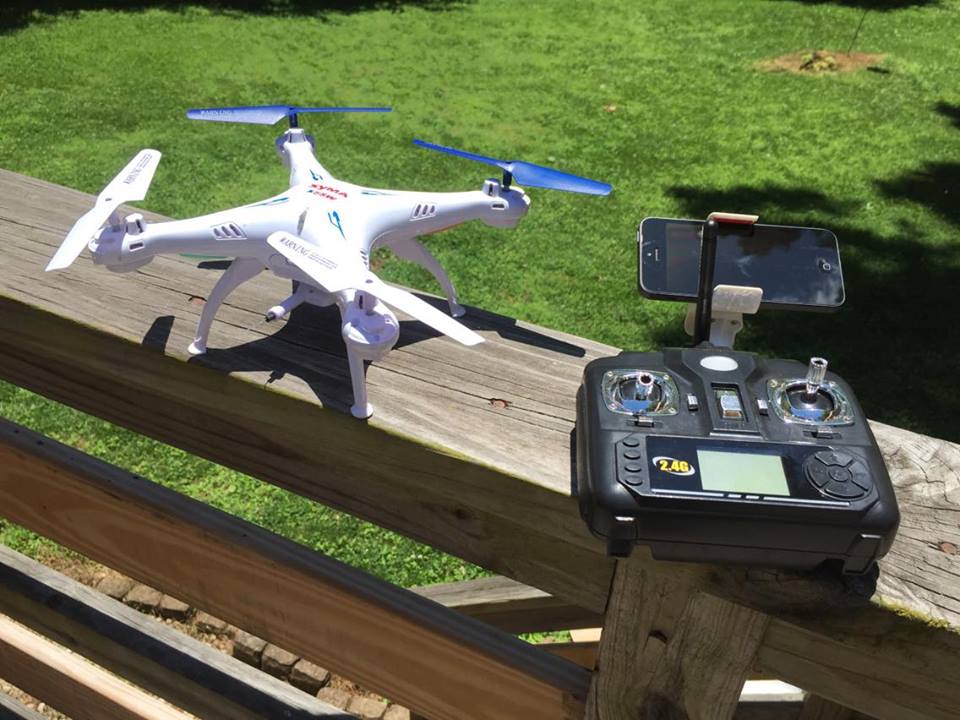
Before we get started, I wanted to share photos of a couple of my friends' drones. This first one is a small $50 model that my friend David has been experimenting with. It is under .55 pounds, and therefore doesn't have to be registered (ie, "These are not the drones you (the FAA) are looking for.").
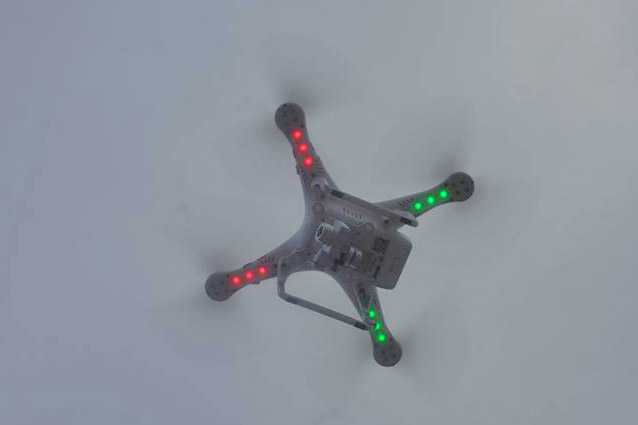
This second one belongs to my other friend David, and is a much bigger and more expensive model (sells for over $1,000) ... and this is one of the drones that would need to be registered in the FAA database.
So, about this registration database... The FAA has released it in the form of an Excel spreadsheet, and named it with the date as part of the filename (Reg-by-City-State-Zip-12May2016.xlsx). I would have rather they used a more generic name that would always stay the same, so I could set up a SAS job to always read the latest data every time I run it... maybe a future version will be like that.
The spreadsheet has one tab for Hobbyist, and another for non-Hobbyist. I decided to focus on just the hobbyist data, and used SAS' Proc Import to import the desired range of cells on that tab of the spreadsheet.
PROC IMPORT OUT=my_data DATAFILE="Reg-by-City-State-Zip-12May2016.xlsx" DBMS=EXCEL REPLACE; RANGE="Hobbyist$A3:E39462"; GETNAMES=YES; MIXED=NO; SCANTEXT=YES; RUN; |
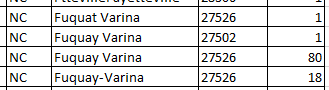
The data had five columns: Country, State/Province/Region, City, Postal Code, and Number of Registrations. I subset the data to only contain registrations from the 50 US states (eliminating other countries, US territories, etc). Within the states, they tracked the number of registrations for each unique city/postal code ... but I found the city names were a bit 'dirty', with inconsistencies in upper/lower case, abbreviations, etc. Here's an example - notice there are 3 different spellings for the city with postal code 27256:
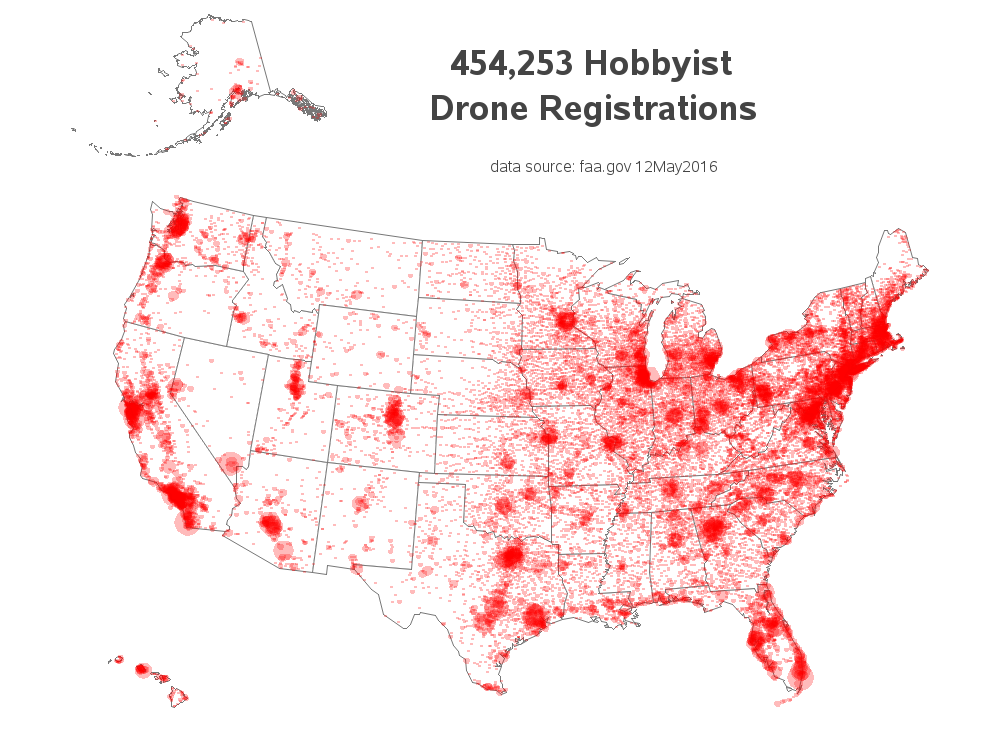
So I decided to just go by postal code, and ignore the city variable. I summed all the counts by postal code, looked up the lat/long coordinate for each postal code in the sashelp.zipcode dataset, and plotted them on a map. The map was a bit too crowded (with most cities having several postal codes), so I summed all the counts by state/city (using the city names from the sashelp.zipcode dataset), and took the average lat/long for each city. I sized the markers by the drone count, and made the markers transparent (so overlapping markers would show as a darker red). I think the map provides a pretty good representation of the distribution of drones across the US.
The drone registrations typically cluster around the population centers - but can you perhaps detect any other (smaller) trends in the data?
What do you think about hobbyist drones? And what do you think about rules & registration for them? Feel free to share your thoughts in a comment!


8 Comments
The strange weight limit of 0.55 pounds is not so strange to those of us outside the USA. It is almost exactly 0.25 kg. I'm pleased to see you are using stealth metric units.
.
Maybe in future for your readers in the rest of the world (and all scientists) you could provide metric equivalents? We don't understand feet, pounds, gallons and Fahrenheit.
Hahaha - "stealth metric" ... I like that! :)
Note that we do use the metric system in the US. We have 2 liter drink bottles! (but notice, even there, we use our own spelling)
When it comes to the metric system, I think we have "voted ourselves out" of that union. ;)
Good job,
You could try to see how the data changes over time.
I saw that they published an RSS feed. You can try subscribing to the their feed http://www.faa.gov/news/updates/feed/ and checking for stories in the future where they use a similar file name "http://www.faa.gov/foia/electronic_reading_room/media/Reg-by-City-State-Zip-" (assuming they'll keep publishing it in Excel format)
Hmm - good idea!
Why not read in the files using the pipe option?
There are usually several ways to do things in SAS - I'm all-ears ... what did you have in mind with the "pipe option"? Can you show the syntax you're proposing? :)
(Note that I used a filename w/ url to download the xls file, and then proc import to import it.)
Love the map! Could you share your SAS code to create the graph?
Thanks! - Here's a link to the code: http://robslink.com/SAS/democd86/drone_registration_info.htm