With more and more data available these days, and computers that can analyze that data, it's becoming feasible to look for fraud in events such as the Boston Marathon. So put on your detective hat, and follow along as I show you how to use SAS to be a data sleuth!
But before we get started, I wanted to share a picture of my old college buddy Jenny - she actually ran in the Boston Marathon yesterday. She's quite the runner, and I'm really proud of her (and a bit jealous that she's in so much better shape than I am!)
With the Boston Marathon in the news, I couldn't help but look around for some examples showing what people had done with the data. I found a *very* interesting article about detecting people who might have cheated when qualifying for the Boston Marathon. Derek Murphy is one of the data sleuths who is passionately analyzing the data, and one of the metrics he uses is to identify the runners who ran the marathon at least 20 minutes slower than their qualifying time. Here's a graph he created:
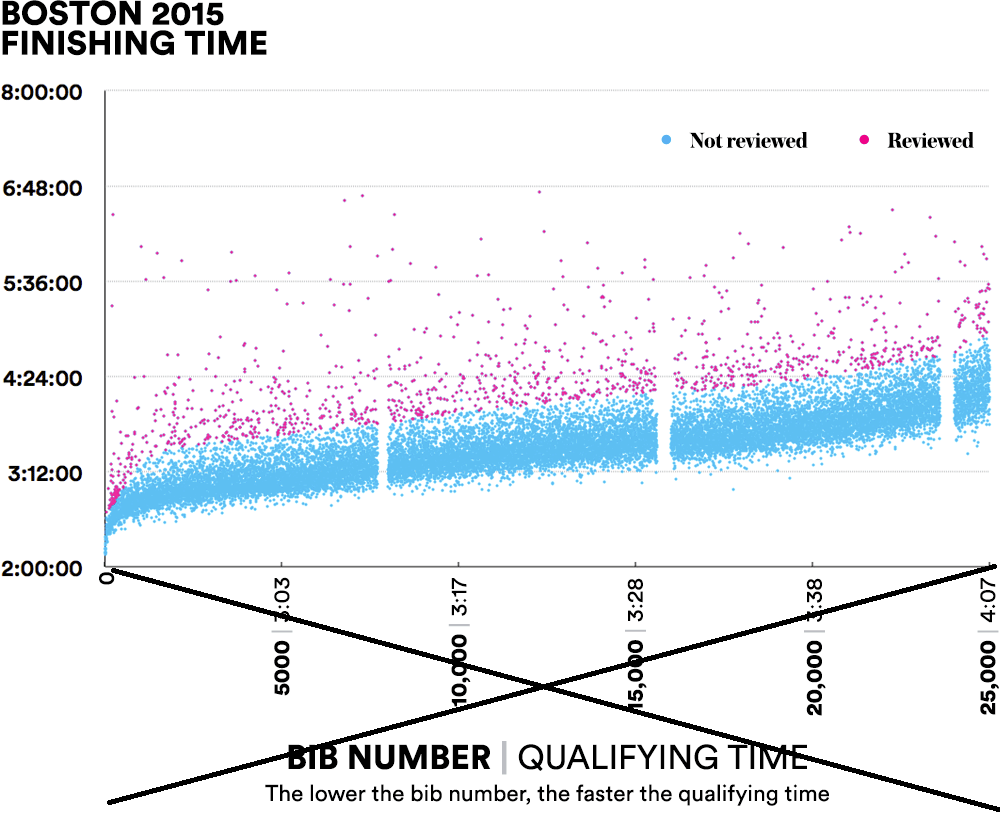
I think it's a pretty neat graph, and I really like it ... except that the bottom axis is a bit busy/confusing. So, of course, I decided to create my own version!
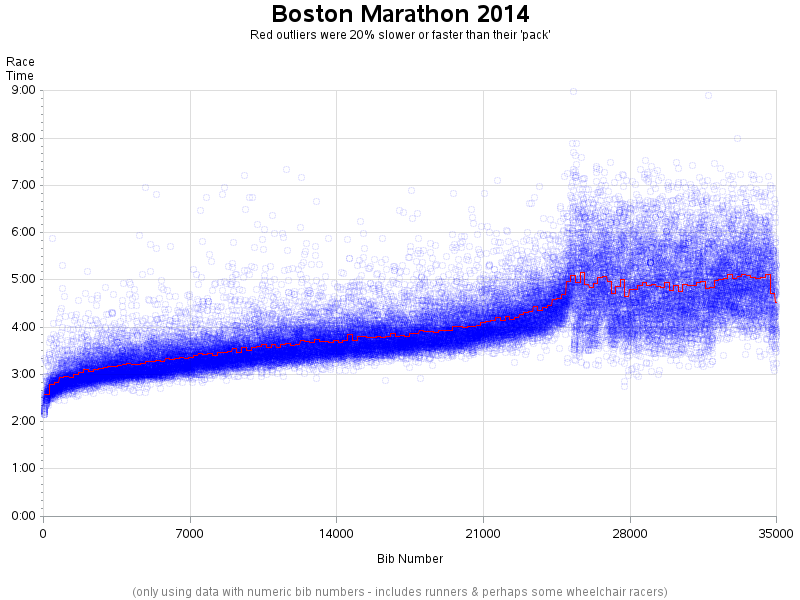
I did a bit of searching, and found that Bill Mill (llimllib) had set up a Github page with some past Boston Marathon data he had scraped from the Boston Athletic Association website. His data collection didn't contain the latest data (it only went up to 2014), but I decided it would be close enough for my purposes. I downloaded the data, imported it into SAS, and created the following plot. Note that the bib numbers in the Boston Marathon indicate runners’ qualifying times - lower numbers mean lower qualifying times, and faster runners.
I simplified the axes a bit, used transparent circular markers rather than solid dots, and included all the data, rather than limiting it to just the competitive runners (I think the last ~1/4 of the runners are more of the fundraisers, rather than competitive runners?):

Murphy's graph highlighted the runners who ran the marathon 20 minutes slower than their qualifying time -- but the data I was using didn't include the qualifying times, so I had to find a different metric to compare the times against. After a bit of head-scratching, I decided to divide the runners into groups (or packs) of 200, and calculate the average speed of each group. I then plotted that average speed as a red line on the graph (I might could have gotten a smoother line by using a "moving average" but I decided to stick with simple for now).
I then identified all the times that were 20% above (or below) the red average line, and put a red 'x' through those circular blue markers. I also added html hover-text so you can see the name & time for those runners, and if you click on them it will launch a Google search. (You have to first click the image below, to see the interactive graph.)
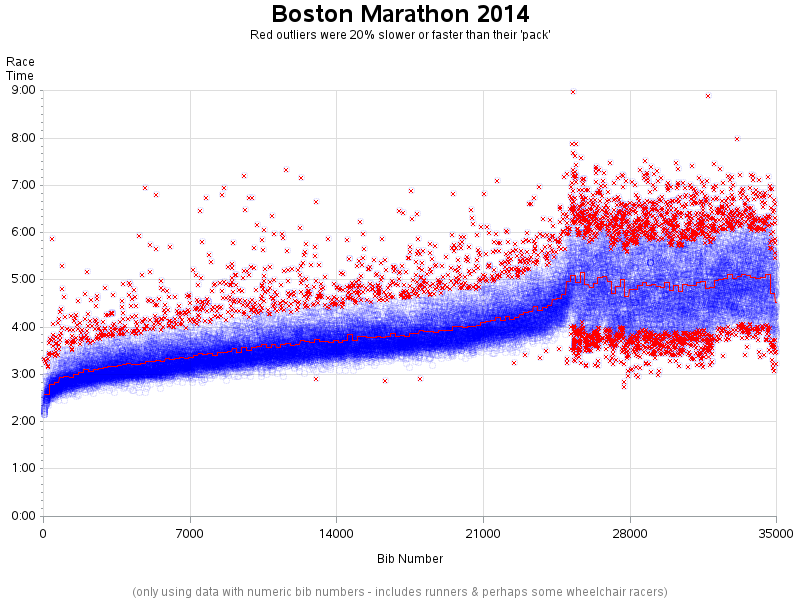
Note that just because the markers are red doesn't mean these people necessarily cheated! If they ran the marathon 20% slower than their qualifying time, they might have been dealing with sickness, injury, or lack of sleep. Or if they ran it 20% faster than their qualifying time, perhaps they had improved that much by hard practice. But it does perhaps warrant a little extra scrutiny, just to make sure everything is copacetic.
Now it's your turn - what other kinds of fraud analytics would you like to run against marathon data? Or what other kinds of data could these marathon analytics be applied to? Feel free to leave your ideas and suggestions in the comments section!


5 Comments
Robert,
Another excellent post, and this one is of particular interest to me since I have had the privilege to run two Boston Marathons.
I am not surprised to read that many people run Boston slower than their qualifying times for two reasons:
1. It is very, very hard to get a Boston Qualifying time (BQ). I have many talented running friends who have been after one for years. Many savvy runners pick a flat course such as Chicago, London, or Berlin; or a mainly downhill course such as St George Marathon (Utah) to give them the best possible advantage to hit that very elusive BQ cut for their age range. Consequently, many BQ's reflect the absolute maximum that a runner can put out on an optimal course.
2. Boston is a nasty course, especially starting around mile 17 when you have to face the infamous Newton Hills. They are a series of three hills that culminate around mile 21. Being so deep in the marathon, they knock the heck out of many, many runners and are both very storied and feared.
When I ran the 2013 Boston Marathon, I qualified with a 3:36:00 (LA Marathon) and finished Boston in 3:47:19; roughly 5% slower. Though the 2014 Boston Marathon was very inspirational with its tributes to the victims of the previous year's tragedy, it was very hard for me. I qualified with a personal best of 3:28:34 (Chicago Marathon), but finished Boston in 3:57:14; roughly 14% slower. Why? I was smoking along the course until... I finished going over the last of the Newton Hills--Heartbreak Hill. There, I cramped up something fierce and hobble-ran the last 5 miles to the finish at Boylston Street.
So, Boston Marathon finishers that are slower than their qualifying times make sense to me. However, knowing how hard it is to get a BQ in the first place, I would be very suspicious of runners who run significantly FASTER than their BQ times. What's up with that?
Finally, I found your 2013 graph to be somewhat chilling and somewhat sad, seeing the sudden stoppage of bib numbers at about the 2100 mark; signifying about when the tragedy happened and the race was stopped.
----MMMMIIIIKKKKEEEE
Mike - thanks for checking in, and thanks for providing lots of inside-insight into the Boston Marathon data!
Robert,
My pleasure! I would have written more, but I had to run...
----MMMMIIIIKKKKEEEE
Nicely done, Robert. As an avid runner, I found this really interesting. Then again, I know my chances of qualifying for Boston depend on me running when I'm 90 years old before I'll make my BQ time.
Some other ways they use to identify "cheaters" is to look at their splits. Some runners have been found to be consistently missing times from the timing mats around mile 15. Also, examining on-course race photographs and not being able to find a runner being photographed is another data point.
Keep up the great work demonstrating visualizing techniques applied to interesting problems!
Thanks for the extra info, Kevin!