People have always been fascinated by sports statistics, and with the recent popularity of fantasy sports there is an increased demand for custom analyses of the sports data. With those folks in mind, I have created a simple example that SAS programmers can use as a starting point for analyzing NBA data.
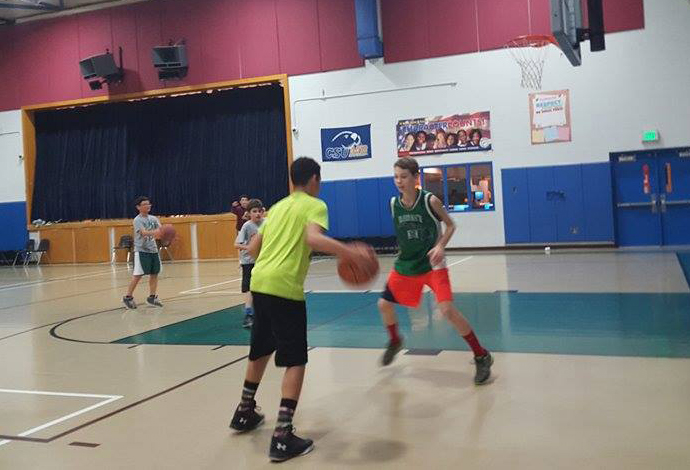
Before we get into the nitty gritty details, here's a picture of my friend Simone's son playing basketball (in the bright shirt, with the ball). He's tall, in shape, and smart, so I think he'll do well in basketball. Who knows, maybe one of these days we'll all be plotting his data in our NBA graphs!
I had recently read about some examples that demonstrate how to use the Python and R programming languages to analyze the NBA data, and decided to try my hand at using SAS to do something similar. With a bit of digging, I found the magic url that can be used to download the data for a specified player & season. I then wrote some SAS code to import the data directly from the Web page, into a SAS dataset.
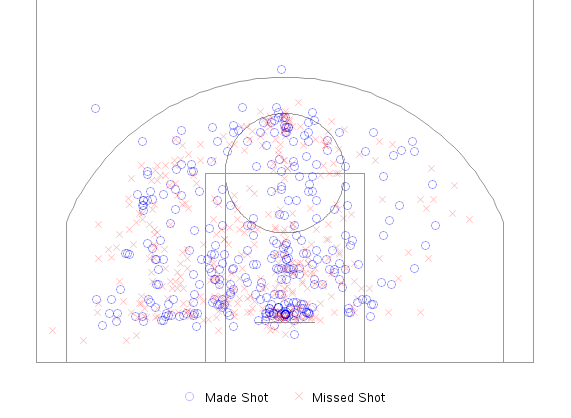
After scrutinizing the data a bit, I determined that the 0,0 origin coordinate was in the middle of the basket, and all of the shots were shown in relation to one end of the court. I looked up the dimensions of an NBA basketball court, then determined the coordinates of the 4 corners, and created a map polygon I could use to represent the court in Proc Gmap. I then converted the shot data into an annotate dataset that would plot the missed shots as red x's and the made shots as blue o's. Here's what things looked like so far:
![]()
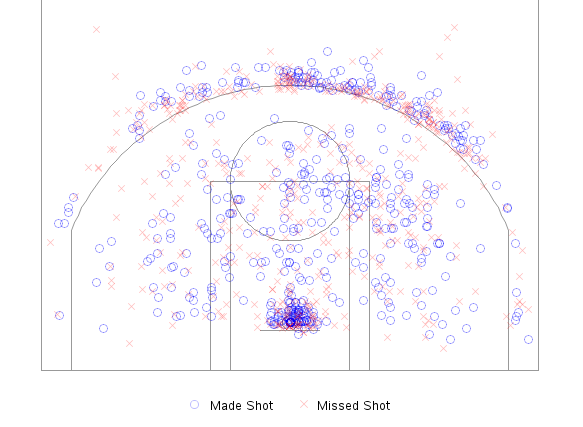
The above graph is nice, but it would be even better with some points-of-reference so we can see 'where' the player was when he made the shot. Therefore I worked out the coordinates of all the markings on the court, and created a special annotate dataset to draw them on the map (using annotate draw and polygon functions). Wow - what a difference that makes!How to graph NBA data with SAS #analytics Click To Tweet
![]()
The Proc Gmap approach is a good starting place for a spatial analysis, but how about analyzing the data over time? It was a simple matter to feed the data into Proc Gplot, and generate the following. Do you notice any trends in Stephen's shot data? Can you explain the outliers?
![]()
Just for Fun:
Here's a little quiz, to test your NBA knowledge, combined with your visual analytics perception skills. Below are three graphs - can you tell which goes with Kevin Durant, Lebron James, and Marc Gasol:
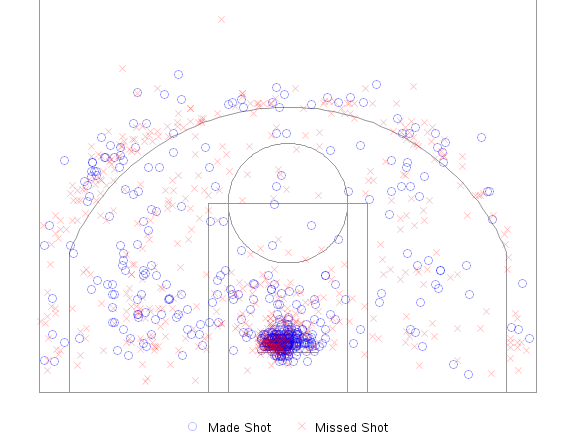
(Once you've made your guess, you can 'cheat' and look at the filenames of the images for a hint!)


18 Comments
I think I am an NBA fan but I fail to identify Lebron and Durant's plots in the final quiz. I am so ashamed.
I bet you'll pass the quiz next time! :)
Hi, kind of resurrecting a two year old topic here, but I'm working on a group project for an analytics class based on nba shot data and this would be immensely helpful for us.
Wondering which SAS tool you used to create this, and whether any trials would be accessible?
I used the SAS/Graph product. Unfortunately it's not available in our free/trial university edition.
The ironic thing: In 2016-17 Marc Gasol started shooting 3's and his chart probably looked a lot like Durant's.
Pingback: My top 10 graph blog posts of 2016! - SAS Learning Post
Pingback: Wie treffsicher war Jordan unter Druck? - Mehr Wissen
I wanted to imitate your work, but the code doesn't work!
There was no observation in 'my data', and I am poor at SAS, so I could not find what is the problem.
Please comment..
Have you defined the 'my_proxy' macro variable, as described in the comments? Each site will have a different/unique proxy, so you need to define that based on your site...
%let my_proxy=http://yourproxy.com:80;
The my_proxy macro variable's value is then utilized in the filename statement, to get to the data...
filename temp_url url &url proxy="&my_proxy";
How did I find all player IDs?
That was the tough part! There might be a master-list somewhere, but here's how I got the IDs for the players I graphed ...
I went to http://stats.nba.com, I clicked Player Stats -> Player Index, I selected a player, then clicked the 'Stats' tab for that player, and looked in the URL. (For example, Arron Afflalo's stats page url is http://stats.nba.com/player/#!/201167/stats/, and his player ID is 201167.)
Wow, really clever. I have to tip my hat off to you. Great work buddy.
How did you find that url?
I can't remember exactly what page I got it from. I did a bunch of Google searches, and tried out several existing web-based NBA data query tools, and copy-n-pasted the URL from one of them, and trimmed it down a bit to do what I was wanting :)
Pingback: Nonparametric regression for binary response data in SAS - The DO Loop
Pingback: A statistical analysis of Stephen Curry's shooting - The DO Loop
So cool! I went to Virginia Tech with Stephen's father, Dell Curry, before the school became well-known for its football program. Dell was year ahead of me.
Very cool - such a small world, eh!?!