We recently had a flooding event at Jordan Lake where the water rose almost 20 feet above normal. This blog details that flooding event in both photos and graphs. If you're intrigued by weather, boats, or lakes then this blog's for you!
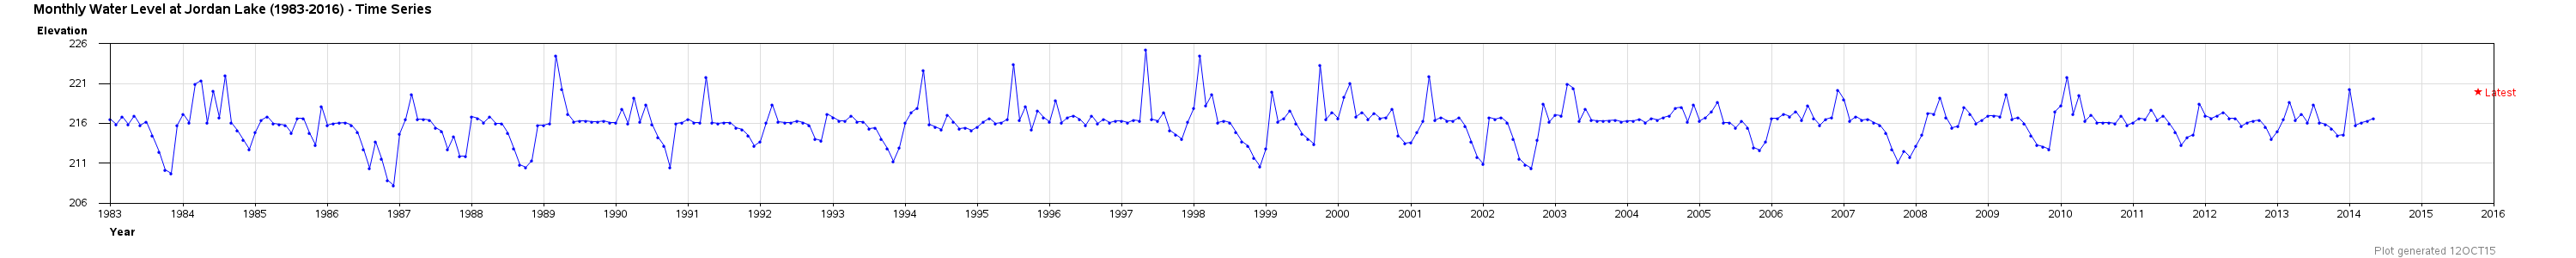
In NC's Research Triangle Park area, there are basically two lakes - Falls Lake, and Jordan Lake. Jordan Lake is just to the west of Cary, and about 30 minutes from the SAS headquarters. It is a man-made lake, and it was filled around 1983. Here's a graph of the monthly lake level since then:
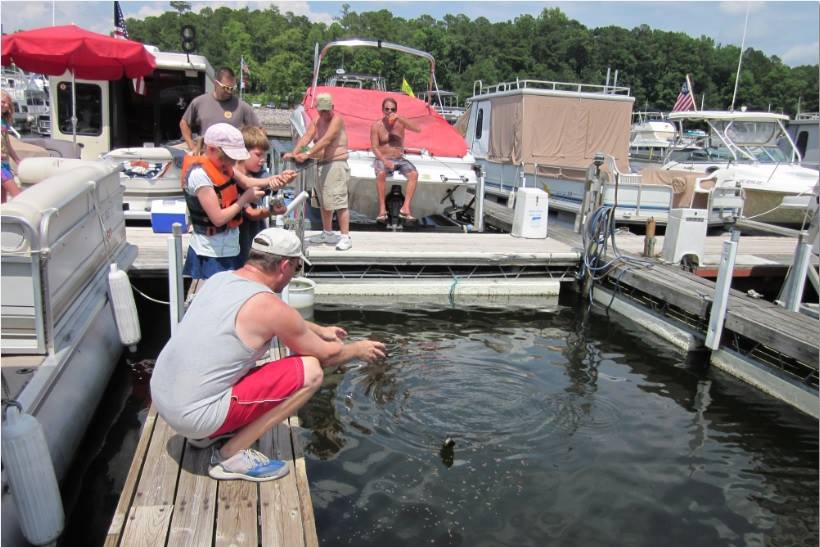
I have a big pontoon boat at the marina, and spend about 1 afternoon a week there, boating, fishing, and hanging out with my boat buddies. Here are a bunch of us guys teaching my niece how to fish :)
Jordan Lake is Cary's main water supply, and it also provides flood control for the cities downstream, between Raleigh and the coast. They carefully control the water flow at the dam to buffer the water from heavy rains, and slowly release it so the downstream towns don't get flooded. But in doing so the lake level rises and falls ... a lot. And it recently rose higher than I've ever seen it - so high that the marina was closed for a few weeks!
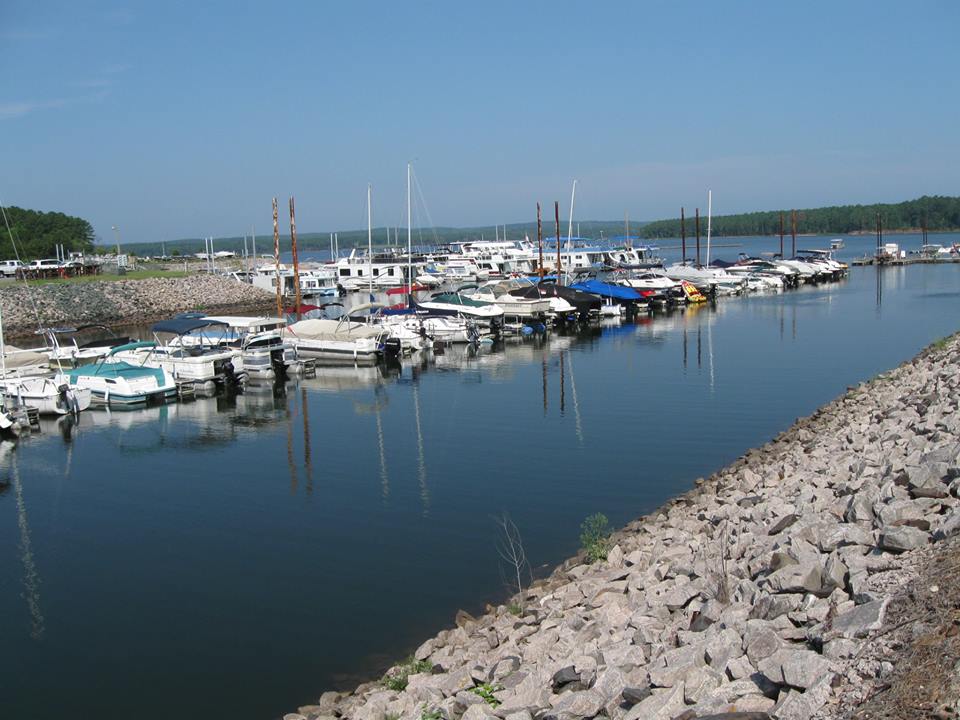
Here's a picture showing the lake at the usual level, about 15 feet below the roads and parking lots.
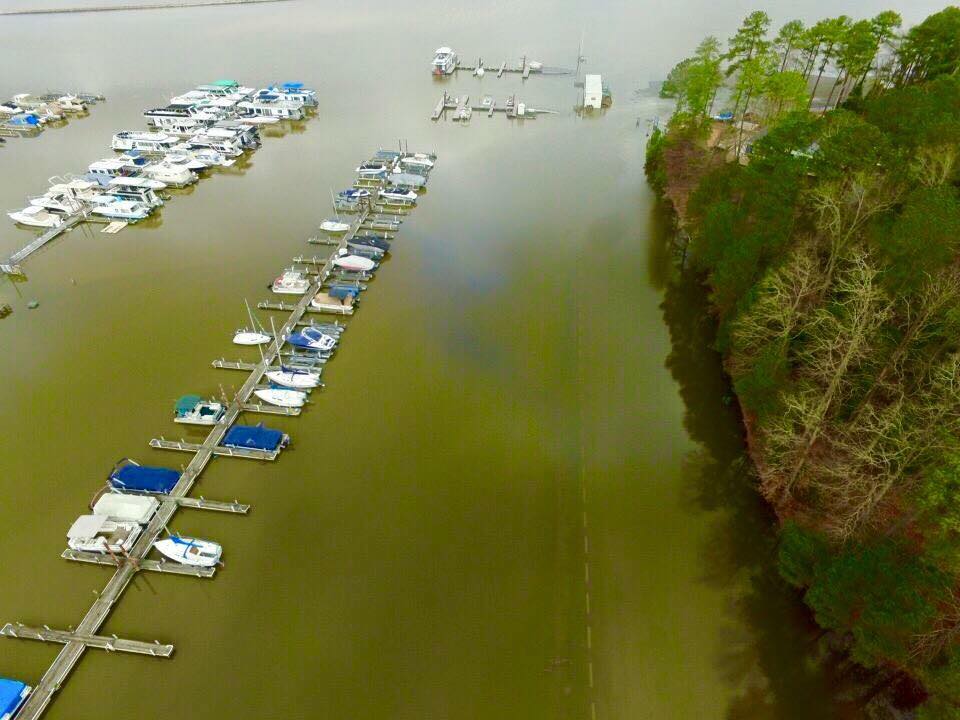
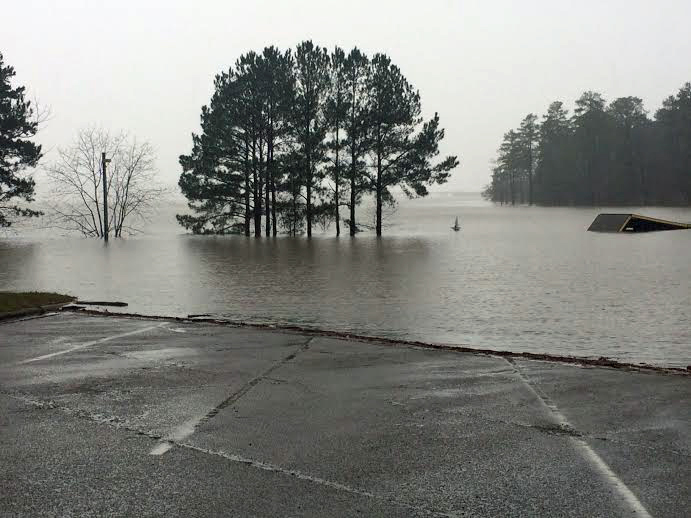
Here's a picture Paula's friend Mark took using his drone, showing the flood. This is an overhead shot of the same area as the previous picture. In this shot, you can barely see the 'stripes' along the side of the road, which is under water (the stripes are the concrete bumpers at the end of the parking spots along the road). Notice the white houseboat in the top/right area of the photo ... oh wait, that's not a houseboat - it's the marina office!
Here's a picture from John, showing another floating dock, at quite an awkward angle. The water is really up!
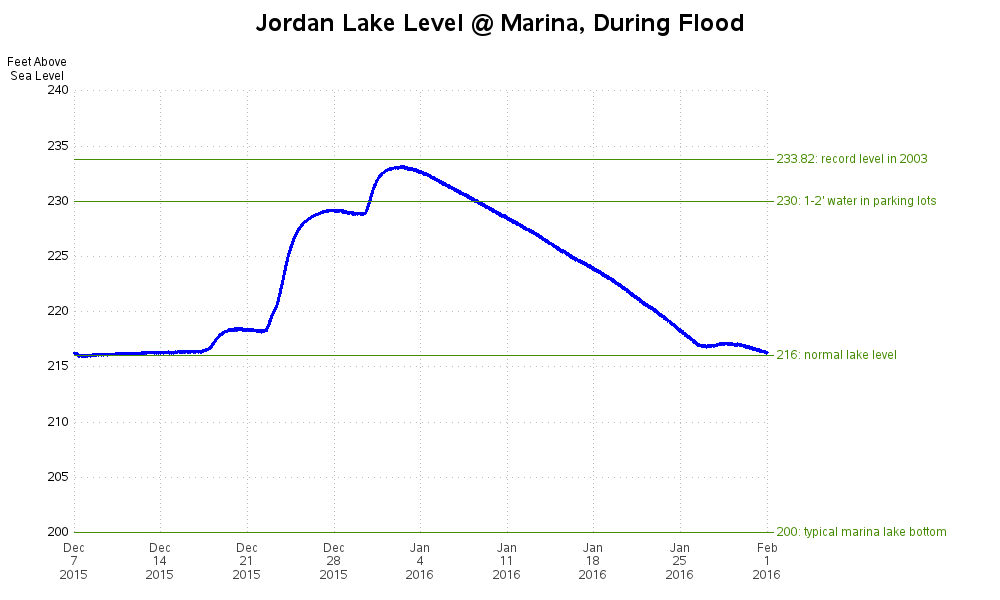
The pictures show some flooding, but I think an analytic graph is even more dramatic, and helps tell the complete story. It shows that we had 3 separate rain events back-to-back during a 2 week period, and that the third one was what put the water over the banks and into the parking lots (which is where the real trouble started for the marina). Notice how the custom reference lines I annotated on the graph really help put the flooding data into context.
What's the biggest flood (or natural disaster) you've had in your area? And did any of you data analysts graph the data?!? :-)


1 Comment
That's quite a bit of water!
We had floods in Brisbane in 2011. I didn't graph the data however there is a map at http://www.bom.gov.au/qld/flood/fld_reports/qld_flooded_towns_2011.pdf The bureau of meteorology also provide detailed reports on all other floods in Brisbane at http://www.bom.gov.au/qld/flood/fld_reports/reports.shtml