As I continue to apply analytics to various aspects of Halloween, I turn my attention to planning my trick-or-treat route ...
Random picture: Here's a shot of my friend Sara's trick-or-treat crew. With tiny legs, and huge loads of candy, having an efficient route is very important! :)
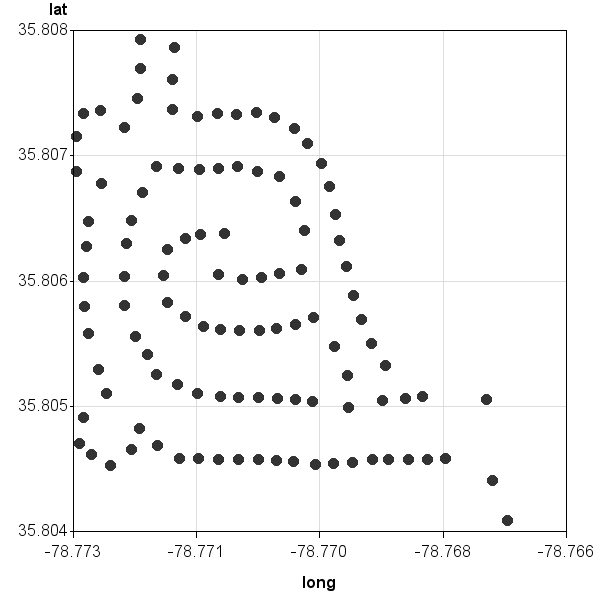
I started by creating a list of all the houses in my neighborhood, and determining the lat/long coordinate for each house. I stored this information in a SAS dataset, and now I can plot & analyze the data. Here's a simple scatter plot of the houses.
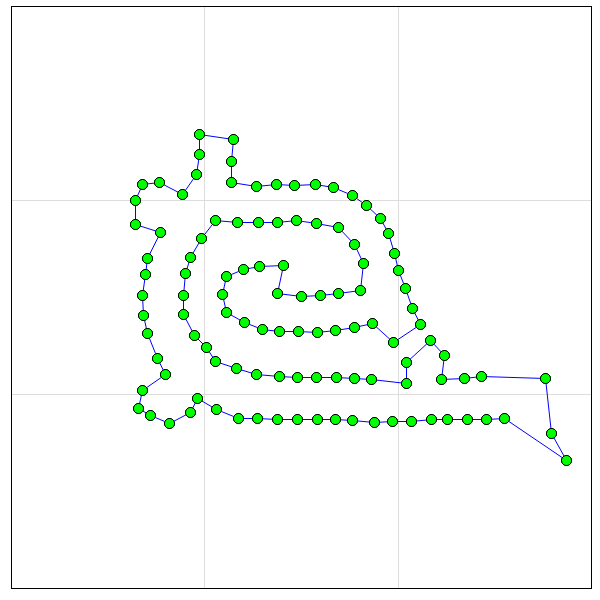
Now for the big question - what order should I visit the houses to be most efficient? I turned to SAS/OR's Proc OptNet for the answer. First I pre-processed the data, generating a list of every possible pair of houses, and then used the geodist() function to calculate the distance between each of those pairs. I then used Proc Optnet's TSP statement to utilize the traveling salesman problem algorithm to generate an efficient order in which to visit all the houses. Here is the resulting route:
And now, to put it all into context, I downloaded the nine openstreetmap map tile map images for this area, and annotated them behind the graph:
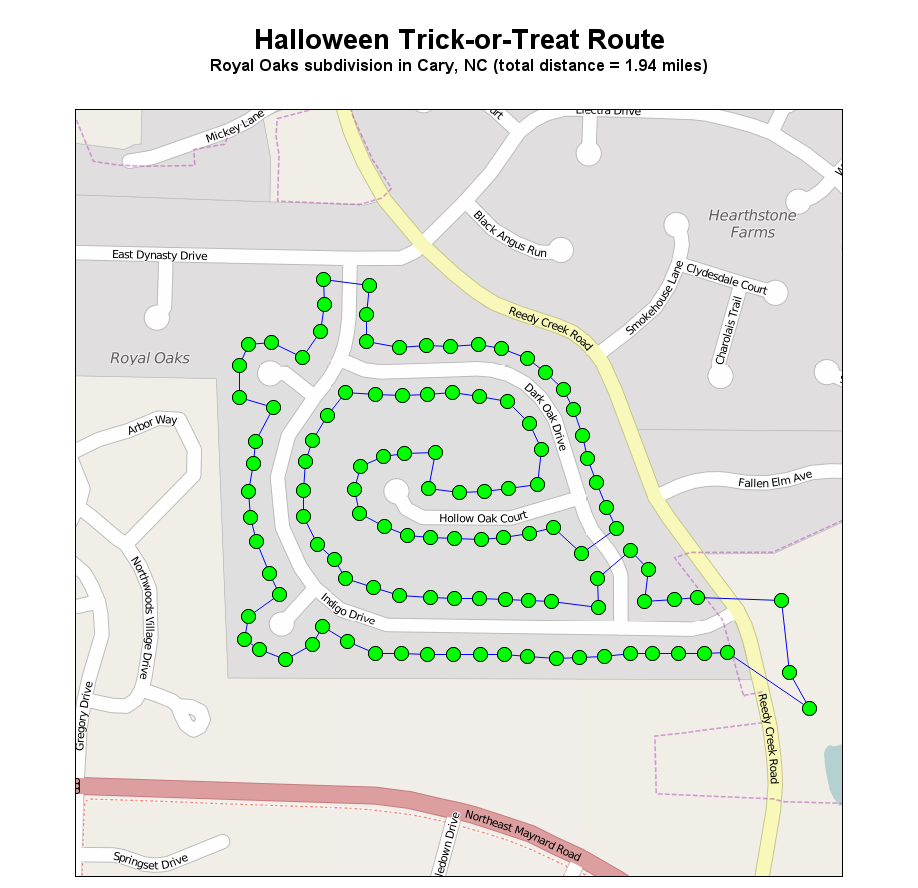
This produced quite a nice looking Halloween route map, if I do say so myself!
And it's not just a route map. Click the image above to see the interactive version of the map, and you can then click on each house and view the Wake County real estate data. This will let you know things like the owner & value of the house (perhaps more expensive houses give out more expensive candy?!? ... I guess I'll have to collect more data to determine whether that's true!)
How many houses do your kids visit at Halloween, and how do you plan your route? (feel free to leave a comment)


6 Comments
Pingback: How to scare up a few good graphs for Halloween - SAS Learning Post
I see potential for a trick-or-treat Yelp-style app here. Costumed kids can rate houses in real time by the amount and type of candy they hand out, thus helping other kids in the neighborhood to optimize their visits by hitting just the houses that yield worthwhile treats -- avoiding the not-at-homers and popcorn balls.
Hahaha! - I can imagine this app having a "Full size Snickers" button! ;)
Truly preparing your children for the ever evolving age of analytics! When they see their candy futures rise they'll be hooked. What data will you be collecting on Halloween?
Neat analysis here, Robert! My son has put some thought into how he approaches it and it all has to do with how lazy/tired he feels. If he goes with one of his buddies who lives in a subdivision with wider lawns, the candy is often "better" (full-size candy bars, for instance, less of the "fun size"), but they have to do much more walking. If he goes to a more densely-populated subdivision, he can "hit more houses" more quickly, but it's often more "fun size" candy. Either way, he only keeps so much and then he sells his excess to his Aunt B, so he's decided he's going to just go to our closest neighbors and then hand out candy at our house, where he can cherry-pick his favorites from our bowl!
Interesting! - I like your son's thought process! :)