Every year, Fortune magazine compiles a list of the 500 largest US corporations - called the Fortune 500. Their list was a bit difficult to digest in text-form, so I thought I'd try using some maps & graphs on the data ...
For a map analysis, I thought it would be interesting to see how many companies were located in each state. The only tricky part here is that I didn't like any of the built-in legend binning algorithms for this particular data, so I created my bins, and then used a user defined format to have the legend show the values that corresponded to my custom bins. You can click the snapshot below to see the full size interactive map, with html hover-text showing all the company names in each state (note that some browsers might have a shorter length limit on the number of names they can show in the hover-text ... I find Google Chrome works well).
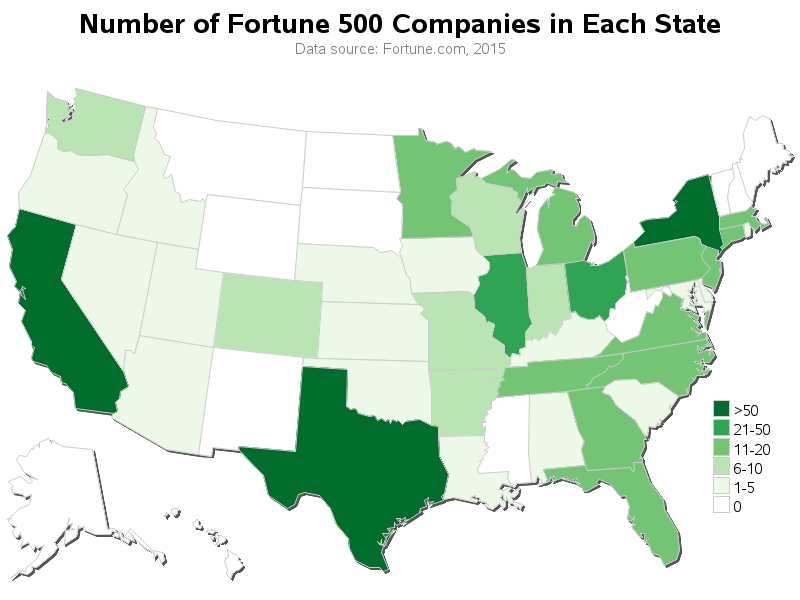
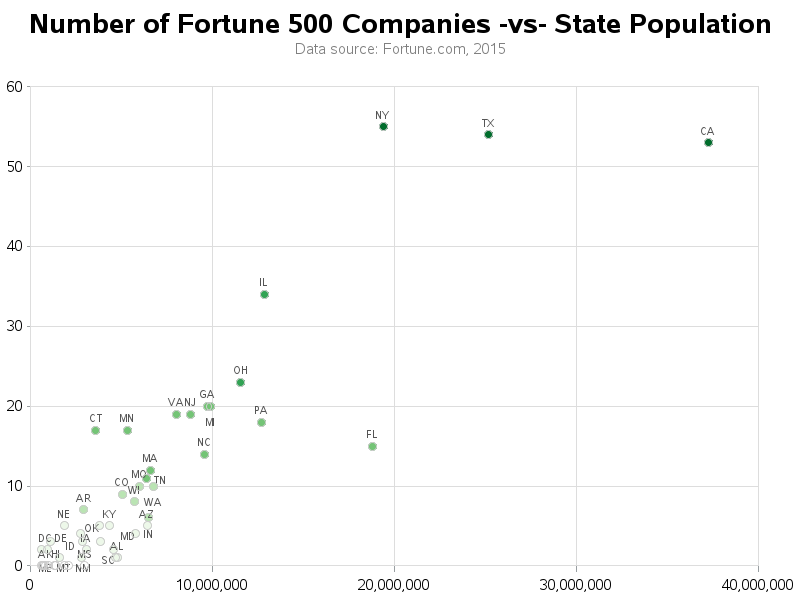
The map was interesting, but kind of predictable - the states with larger populations probably have more corporations, and therefore more corporations in the Fortune 500 list. Therefore I put on my thinking cap to see if I could come up with a way to visualize the data so that I could see if there were any states with a high (or low) number of Fortune 500 companies, for their population.
I decided to use a scatter plot, showing the number of Fortune 500 companies, versus the population, for each state. I used the same color binning that I had used in the map, to tie the two visualizations together (... for better, or for worse). And I added pointlabels to show the state abbreviation for each marker. Based on the scatter plot, it appears that although California has a large number of Fortune 500 companies, its value is a bit low for its population. You can click the snapshot below, to see the company names for each state, similar to the map.
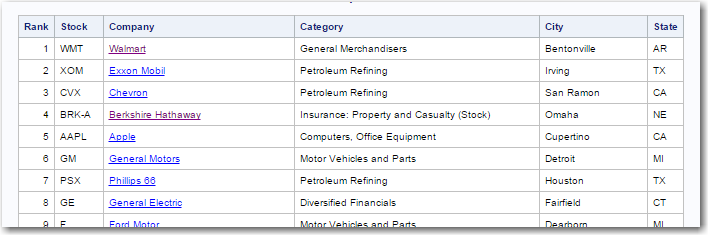
And, of course, I also added a table of the data, with links to more information about each company. Here's a snapshot of a portion of the table - click the link to see the whole table.
What do you think of the Fortune 500 rankings, and what other graphical analyses of the data do you think would be useful?


6 Comments
Hi Robert,
It really wonderful thought, Please let me know how did you load US map, Did you use Latitude and Longitude. I am trying to load New Jersey state map, But I am having hard time to get Latitude and Longitude for each city.
Please advise.
Asha - do you have SAS/Graph installed?
If so, the mapsgfk.uscity dataset has the lat & long of over 150,000 US cities! :)
Once you have the desired lat/long coordinates, you can annotate markers on SAS maps at those locations, using the techniques described here:
http://robslink.com/SAS/book2/Chapter_07_Annotating_on_Maps.pdf
Hi Robert,
A quick question if the data you presented was already stored in SAS dataset. What modification to you Java Code would need to make? Also, I'm running off network based Windows 7 and would connect to SAS server SAS datasets. Thank you ahead time for all of help.
Bharat Thakkar
I only work with the SAS language - I don't really know about Java.
Interesting presentation. What is the ranking criteria for the companies? If it is their capitalization it would be nice to have that value presented as well to see how these companies differ between each other, not just by their numbers by state.
You'll have to read up on the criteria/methodology on Fortune's website: http://fortune.com/fortune500/