There's a lot of buzz about Hadoop these days. I started checking into it, and there seemed to be a gazillion releases. So, being The Graph Guy, I decided to create a graph to make it a little easier to digest!
During my search for Hadoop information, I found the Apache page showing all the releases. As I scrolled down through page after page of releases, I found it difficult to get a grasp on things - there seemed to be multiple versions releasing simultaneously.
I didn't want to have to work very hard to understand Hadoop releases - I just wanted an "Easy Button." And when your favorite tool is SAS, your easy button often looks a lot like a custom graph. :)
I examined the html code behind the Hadoop release page, and found that all the releases had a consistent 'header' line that I could search out and parse programmatically. Here's an example:
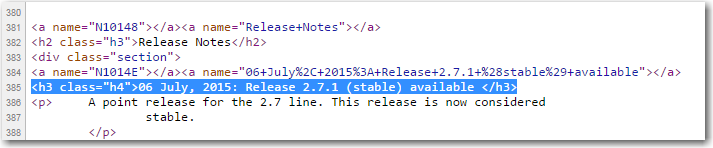
So I wrote some SAS code that would read the html directly from their release page, and keep all the lines that matched the above blue line, and then parsed out the date and release info. I created separate timeline graphs for the 0.x.x, 1.x.x, and 2.x.x releases - all three graphs have the exact same time (x) axis, and the y axes are all consistently sized (10 releases = 1 inch), so they can easily be compared. Here's a snapshot of the graphs (click the image below to see the full size interactive graph):
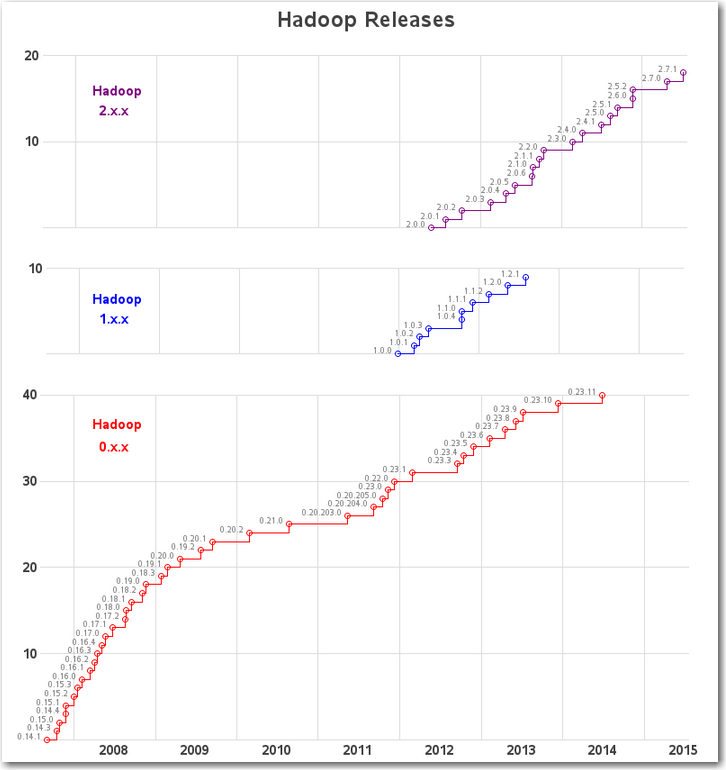
Here are a few more tricks I used on these graphs. I color-coded the markers & title for each graph, I annotated small labels for each release, and there is also html hover-text for each marker showing the release and date, and the drilldown launches a Google search for information on that release. I added horizontal and vertical grid lines to make it easier to visually estimate and compare the 'slope' of the lines (which denotes how frequently releases are happening). And I annotated the year labels at the bottom, to get them positioned exactly like I wanted them.
This graph might not explain everything about Hadoop, but hopefully it's a lot easier to understand the releases now!


3 Comments
Very cool ! Great idea, great implementation, thank you :)
I'll try to include "cloudera"
(with this link http://www.cloudera.com/content/cloudera/en/documentation/core/latest/topics/cdh_vd_cdh_download_previous.html )
and "hortonworks" releases with the same trick !
( with theses links http://docs.hortonworks.com/HDPDocuments/HDP1/HDP-1.3.3/bk_releasenotes_hdp_1.x/content/index.html / http://docs.hortonworks.com/ / http://hortonworks.com/hdp/archive/ )
I'll share when I succeed :)
Thanks for the great Hadoop Release chart! I'm going to incorporate it into my kickoff workshop for developing a SAS/Hadoop implementation exam. Should make for an interesting visual when I ask the group, "Which version of Hadoop are we talking about?" Of course I'll provide credit back to your article.
Excellent - thanks! :)