North Carolina is one of those lucky states that has a huge variety of scenic destinations, such as mountains, piedmont, coastal plains, beaches, and 'outer banks' islands. We have state parks in all of these areas, but can you guess which state park has been trending the most during the past 10 years?
If you guessed the one that is right here within sight of the SAS headquarters in Cary, you guessed right! Umstead park is a 5,579-acre forest (just across the road from SAS), with a few hills/rocks/streams, and lots of hiking trails. The park attendance has grown from ~500k in 2004, to over 1.25 million in 2014.
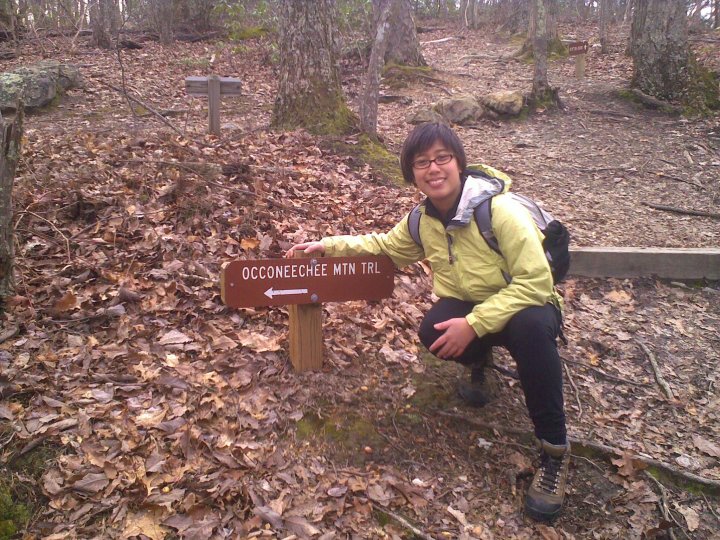
Here's a picture of a hiking trail that my friend Jennifer took. It's very similar to the trails in Umstead park, but this one is actually in the Occoneechee/Eno River park, on the other side of the RTP:
You might be wondering what data I'm using to determine which park is trending. Well that was a bit of a challenge ... Each year, North Carolina State Parks publishes the annual totals, but it is in a jpg image of a table. Here's a screen-capture of a portion of the 2014 table:
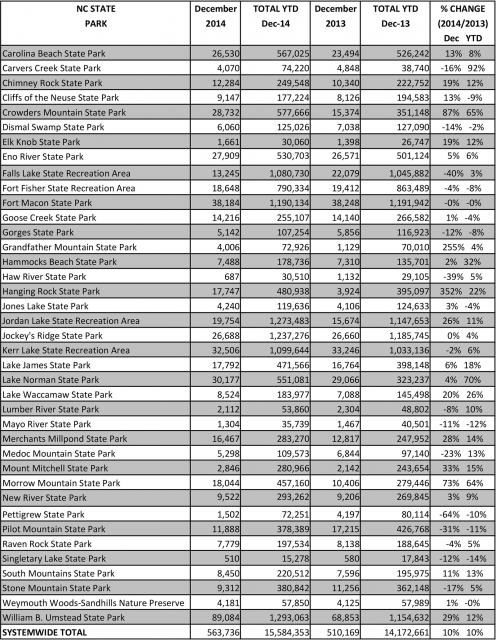
These annual tables were not stored in one central location, therefore I had to do several web searches to find all the tables from previous years. I then visually read the numbers from the jpg images, and manually entered each value as text into a file that I could import into SAS (hopefully not making any typos!) To help error-check my SAS dataset, I calculated the grand total for each year, and compared it to the annual totals at the bottom of the jpg image tables ... and yeah, I found that I had made a few typos entering the data by hand. I fixed my typos, and then was ready to plot the data!
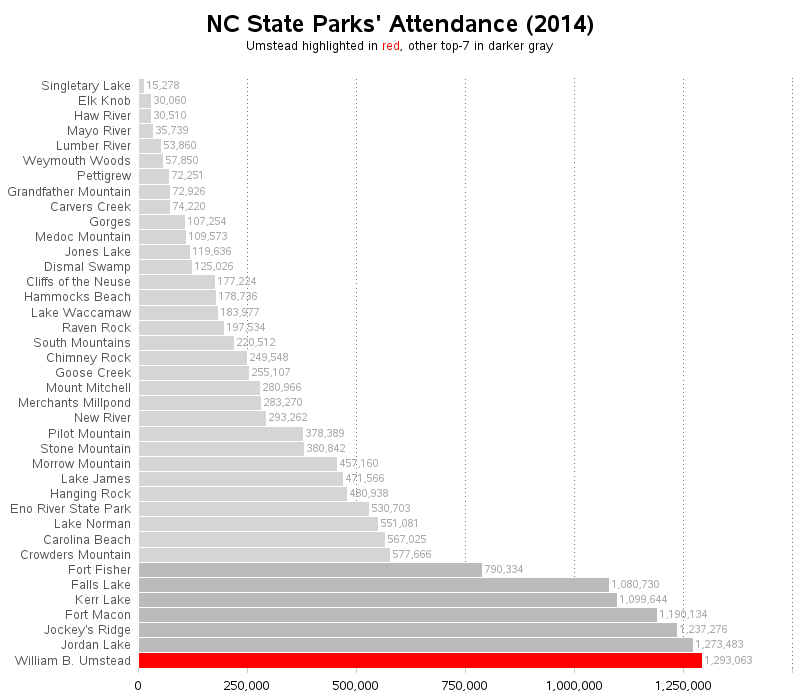
I started with something simple - a bar chart of the current year's data. I wanted to be able to easily relate the data in this chart to my other charts, so I added a bit of color-coding. I made Umstead park red, and since there seemed to be a 'natural divide' in the data, I also shaded the other higher-attendance parks darker than the lower-attendance ones:
Now that we've seen the data for 2014, how about a similar plot for all the years? I used a stacked bar chart, and color-coded it similar to the single-year bar chart. This shows that total park attendance was increasing from 2004 to 2007, and then took a dip in 2008 (maybe because of the 'great recession'?). Attendance leveled-off from 2009 to 2013, and then increased again in 2014.
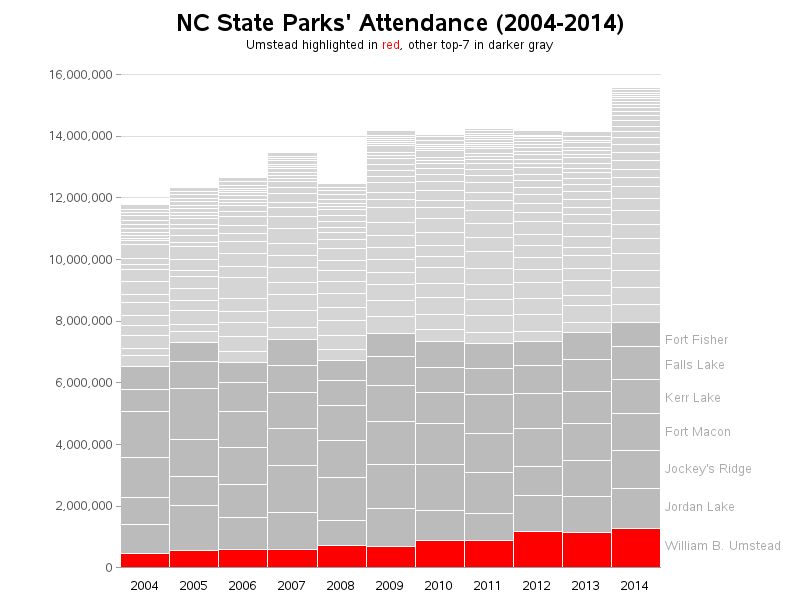
The stacked bar chart 'hints' that Umstead's attendance was generally increasing, but it's difficult to compare it to the other parks. So let's also plot the data in a line chart, which will make it easier to compare all the parks:
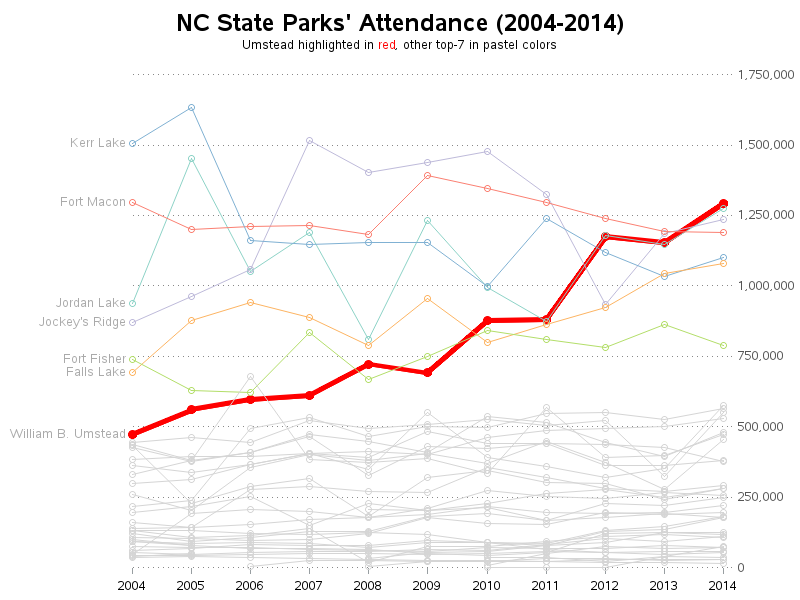
Once again, I make the low-attendance parks light gray, and Umstead red. But it was difficult to follow the lines for other high-attendance parks when they were all dark-gray (because there are several places where the lines intersect), therefore I used different colors for each of them. From this plot, it is easy to see (at least for the high-attendance parks) that Umstead's attendance is definitely trending upward, faster than the other parks.
How high will Umstead's attendance go? Well, we could make a forecast based on the past attendance values and the current trend ... but that doesn't take into account other things, such as limiting factors. For example the parking lots are almost at capacity these days when I visit the park, therefore maybe the park is nearing its capacity (unless they build additional parking lots and/or entrances)? I guess time (and more data) will tell!
What's your favorite state (or other) park? Do you prefer parks with a lot of people, or fewer people?

10 Comments
Great Charts! Is the code posted yet?
Thanks,
Always happy to share the code! ... http://www.robslink.com/SAS/democd76/nc_state_parks_attendance_info.htm
Thanks again! This is very useful.
Love NC state parks!
It’s no surprise that most of my personal favorites are on the “road less traveled”, although it’s too bad they aren’t more popular. Habitats like Lake Waccamaw, Merchant's Millpond and Weymouth Woods are not only beautiful, they are uniquely North Carolina.
Thanks for the post, Robert.
I'm going to have to get out on some of these "roads less traveled"! Maybe I should make it a goal to visit *all* the NC state parks this year, eh?!? :)
Thanks Robert for the charts. My wife daughters and I actually visited every state park last fall. We highly recommend some of the less visited sites. Weymouth Woods, Elk Knob, Mayo River, Lumber River, Stone Mountain, and Merchants Millpond are some of our favorites. GO TO THESE, they are worth the trip! We need to revisit many of them in the mountains this year, esp. Gorges as it is very expansive. Occoneechee is a great site for a great local getaway. There's actually a small cave on the north side of the mountain. The Eno River and the lack of sun on the north side create a microclimate. The Brown Elfin Knob, in addition to having the rare in this area moth, has rare in this area Chestnut Oaks. You can see similar remnants of Chestnut Oaks on SAS campus in front of building F and behind the Umstead on campus, and a giant one near the picnic shelter.
Good stuff, Bill! Thanks for the inside info!
It might be interesting to see the parks on a map. Are the top parks all near population centers like the Triangle? That was my guess, anyway, as a new-ish NC resident with no knowledge of any of the state parks except Umstead and Jordan Lake because they're near here!
Yep - I've been thinking about showing them on a map! (great minds think alike)
Not sure whether I just want to show locations, or also try to show some aspect of the data as well (and what's the best way to do that!)
I was researching the info to put on a map, and found that they already have a pretty decent map ...
http://www.ncparks.gov/Visit/parks/by_map/main.php