Have you ever wondered whether the area where you live is a good location for producing solar power? Let's create a SAS map to help find out!
To get you in the right frame of mind, here is an awesome picture of some Arizona sunshine, that my good friend Eva took on one of her recent trips:

There's been a lot of buzz lately about solar power - especially now that the price of solar panels has come down. SAS has a solar farm here at the Cary headquarters, and I've seen several other solar farms popping up around our state lately.
But I got to wondering - are certain parts of the country better than others for producing solar power? Intuitively, it seems like certain areas that don't have much clouds & rain would be better than areas that are generally cloudy & overcast. But how can I quantify that?
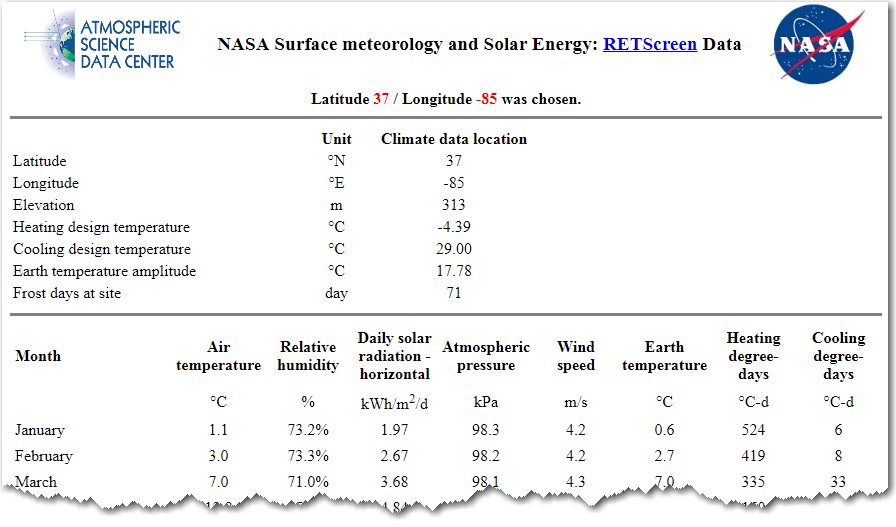
After a few Web searches, I found some data at NASA's Atmospheric Science Data Center. They let you enter a latitude/longitude, and provide an html table (see below) which contains the "Daily solar radiation - horizontal, kWh/m2/d". So I wrote some SAS code that looped through a grid of all the latitudes/longitudes I wanted to plot on a map, and then parsed the desired data out of each of those html pages and appended them to a SAS data step (the code is pretty neat, if you want to have a look at it!)
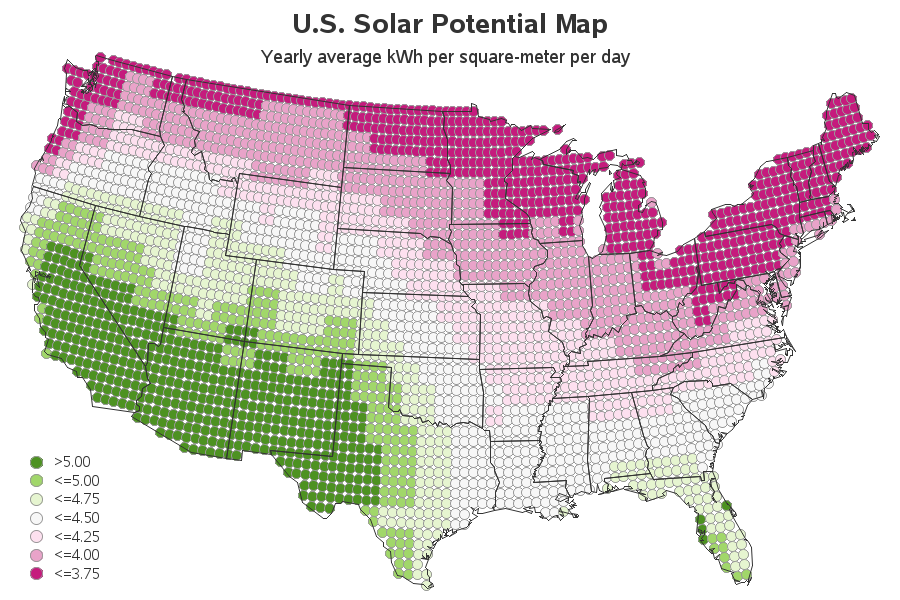
I then used Proc Ginside to determine which points in my lat/long grid were 'inside' the US, and then used annotate to plot color-coded dots on the map to represent the solar data. I think the map came out pretty cool:
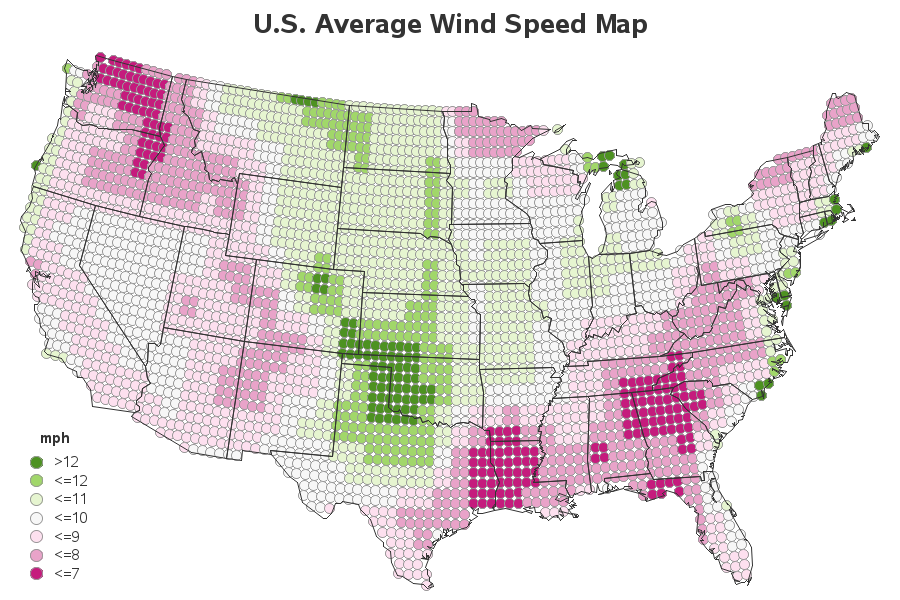
While I was grabbing the solar data, it was also easy to grab the wind data - so I went ahead and created a wind map also. This map might indicate which areas of the country have more wind, and might be better for windmills and wind turbines:
And now for something fun - here's a video clip of me on one of my adventures, in a very windy location (hopefully you can view a .wmv file). Can you guess this windy location?!?


6 Comments
It looks like my area is pretty good for solar power! I thought it would be, but it depends on the season. We don't get a lot of rain, but we do get a lot of snow in the winter. It's definitely something to consider when looking at solar power.
I tweeted my curiosity to see this for Australia and Peter Timusk had a go... https://twitter.com/ptimusk/status/561217044881088512 Great work Peter!
Peter is becoming quite good at mapping this data!
Rob,
Very cool map. Is there a 9.3 workaround for dropmapvars?
You can probably just leave out the 'dropmapvars' option. The resulting dataset will be a little more cluttered with variables that you won't use, but hopefully none of them will interfere with the map :)
I left out the dropmapvars in SAS 9.3 and did maps of Canada and Australia where I used the ID ID instead of ID State.