To get into the mood for this blog post, you should first listen to the music video of The Who singing My Generation...
I guess everybody has 'their generation' and here in the U.S. the most famous generation has been the Baby Boomers. Many companies have tried to design products they think the Baby Boomers would like (such as the 1964 Ford Mustang), to capitalize on the similar interests and buying power of the boomers. But this year, for the first time (according to this article from Pew Research) another generation will become the most populous in the U.S. - the Millennials!
The Pew article had a nice graph that shows which years people from each generation were born in, and how many people were born each year (note that there's not 100% agreement on when each generation starts & stops, but we'll go with these numbers for now). Here is the graph from their article:
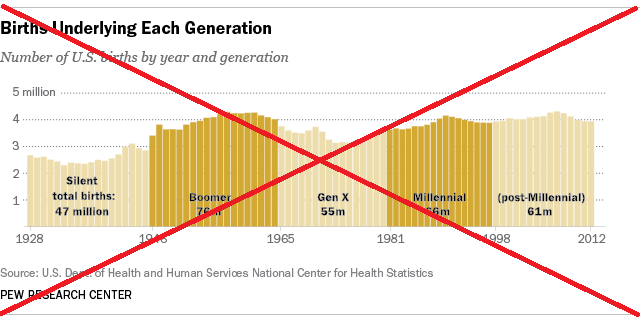
I liked their graph, because I had never really seen the generation data laid out like that. I studied the graph to see which generation they had grouped me into (I'm right on a borderline, and sometimes grouped into 1 generation, and other times grouped into another). But I noticed that I had to look very closely to see if the years along the horizontal axis were for the start, or end, of the generation (most are at the start, but the very last one is at the end ... which makes it somewhat confusing). It also took me a little while to determine what the units represent (births rounded to millions). I came away feeling that it was a nice graph, but I had to work too hard to understand the details.
So, of course, I then set about making my own SAS version of the graph, to see if I could do any better!...
Since the original graph didn't show the exact number of births for each bar, I had to find a source for the births data. I found some of it on Wikipedia, and some of it on cdc.gov. I entered the data into a SAS dataset, programmatically assigned the generation names, and then popped the data into a grouped bar chart.
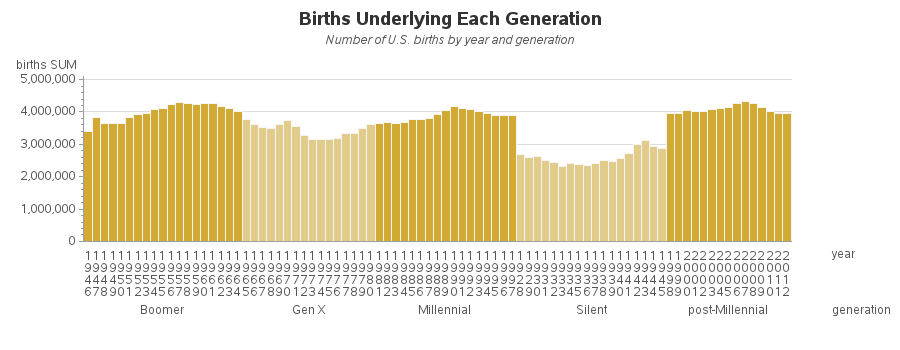
I was thinking "Man, this is going to be a piece of cake!" All I need to do is get rid of the 'year' bar labels, and add a few custom/annotated labels, and I'll be done! But, as my friend Jennifer's post-Millennial baby in the picture below shows, a "piece of cake" can get a bit messy... ;)

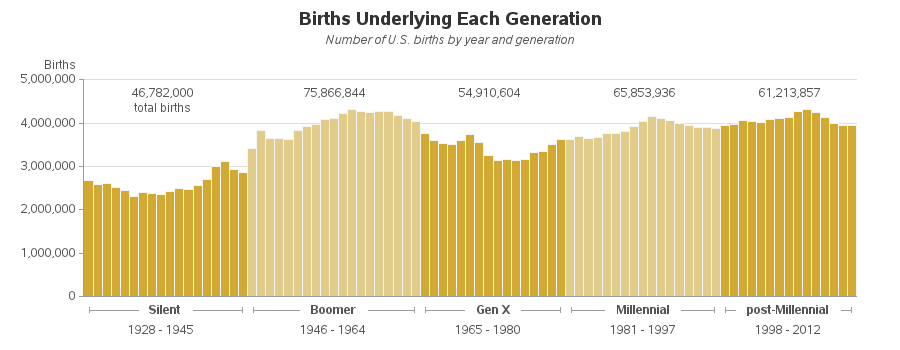
It turned out that I needed to do a bit more work ... If you look closely at my grouped bar chart above, you'll notice that the generations are in alphabetical order. To get them into the desired order, I assigned a numeric value for each generation (in the desired order) and then created a user-defined-format so that the numeric values would show up in the graph as the text generation names. I annotated both the start and end year of each generation below the generation labels, and the total number of births up above the bar groups (I think this is much easier to read than overlapping the labels on top of the bars). And rather than rounding the numbers to millions, I go ahead and show the full values (it uses a little more space, but you don't have to wonder what the units are). I also added hover-text to each bar, so you can see the exact value if needed (click the image below to see the interactive version with html hover-text). I think the resulting SAS graph came out very nice!
What generation are you in, and what product do you think is mainly/exclusively marketed to 'your generation'?

6 Comments
The generations are not of equal length (in years). That may make sense when breaking the age ranges into subgroups for marketing purposes but would be deceptive in other contexts. More importantly, the comparing the number of millennials born to the number of boomers born won't help a marketer because he is interest in the number still alive and able to buy things.
PS, we boomers appreciate the contributions that the millennials are making to the Social Security Trust Fund.
PS, that sort of graph would be really easy to create in JMP.
nice. where's the SAS code?
http://www.robslink.com/SAS/democd75/us_generations_info.htm
Hi Robert!
I'm part of Gen X. Alison Bolen recently shared this blog that perfectly sums up our generation: http://www.emptyage.com/post/11591863916/generation-x-doesnt-want-to-hear-it. Enjoy!
-Michele
:)