In sports these days, there's a lot more data to keep track of than just the score! How can you make sense of it all? Being the Graph Guy, of course I recommend graphing it!
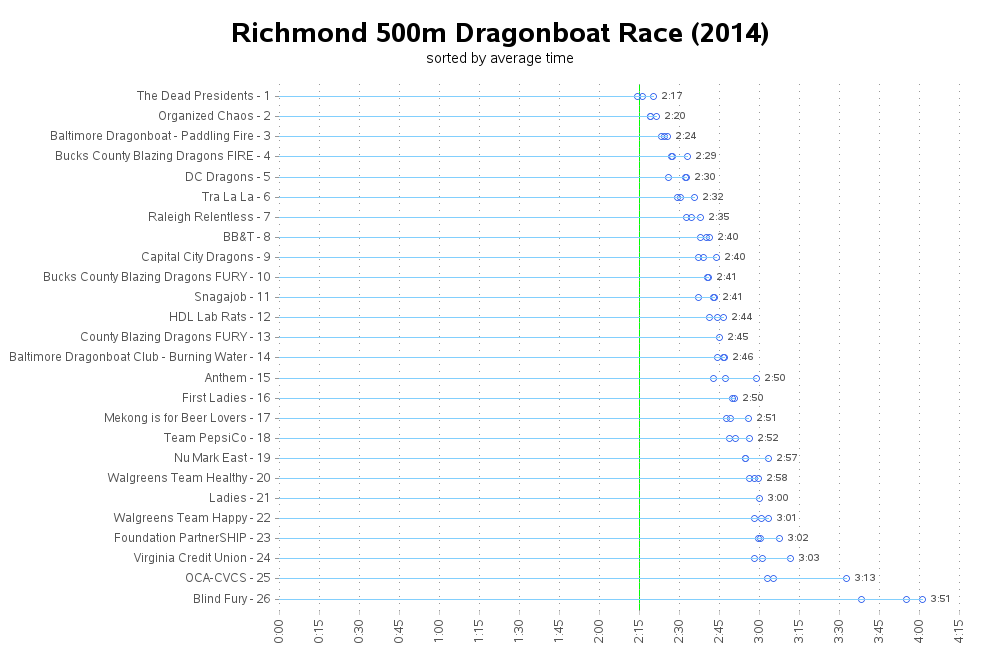
Here's an example that's up close and personal for me - dragon boat racing... Below is a cool head-on picture of our team paddling a dragon boat back to the dock after a race (note that the boat is over 40 feet long, and there are 22 people in it). We are Raleigh Relentless!

When our team goes to a race it's an all day event, with each team racing in several heats against various combinations of the other teams. In each heat, you can easily see how how you did against the other boats in that heat, but what's more interesting and important is how your team is performing compared to all the other teams across the entire day. The times are available in tabular form, but I created the following chart that I think provides a much better way to make sense of the data:
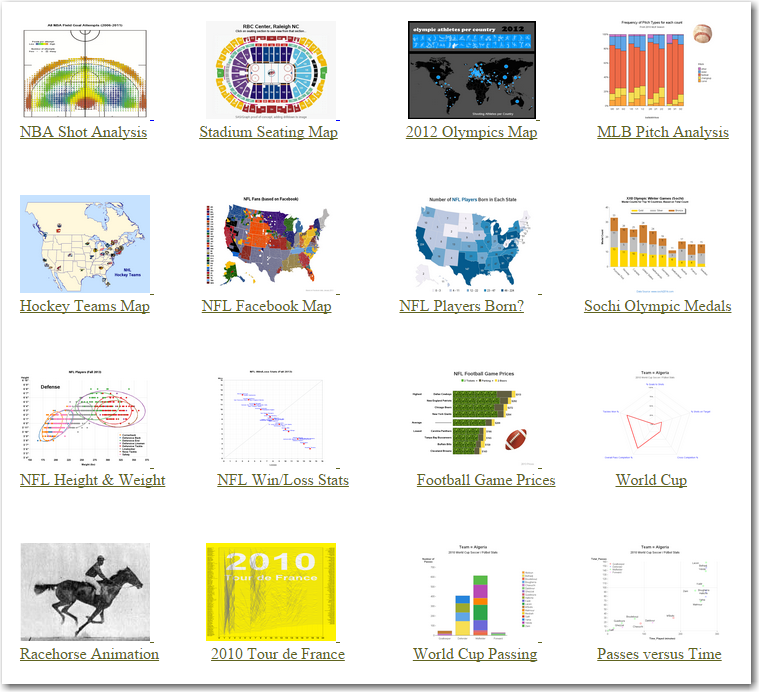
A nice visual analysis of sports data can help capture the fans' attention, help teams know which strategies work better than others, or even help with logistics and seating charts in the stadiums. I've prepared a collection of examples to show you a few of the ways SAS can be used to help visualize sports-related analytics - hopefully you can reuse some of these examples with your own data. Click the screen-capture below to see the samples page:
So, what's the most interesting sport to you, from a data perspective? How do you analyze (or wish you could analyze) the data from this sport?


2 Comments
I'm curious to see how quickly other sports follow suit behind the NFL/Zebra in using RFID to accumulate data and the potential for sports analytics in general...
http://www.forbes.com/sites/jasonbelzer/2014/07/31/nfl-partners-with-zebra-technologies-to-provide-next-generation-player-tracking/
That could certainly generate some interesting data!