Have you noticed lower gasoline prices lately? How low will they go, and how long will they stay down? Let's use SAS to analyze some of the data!...
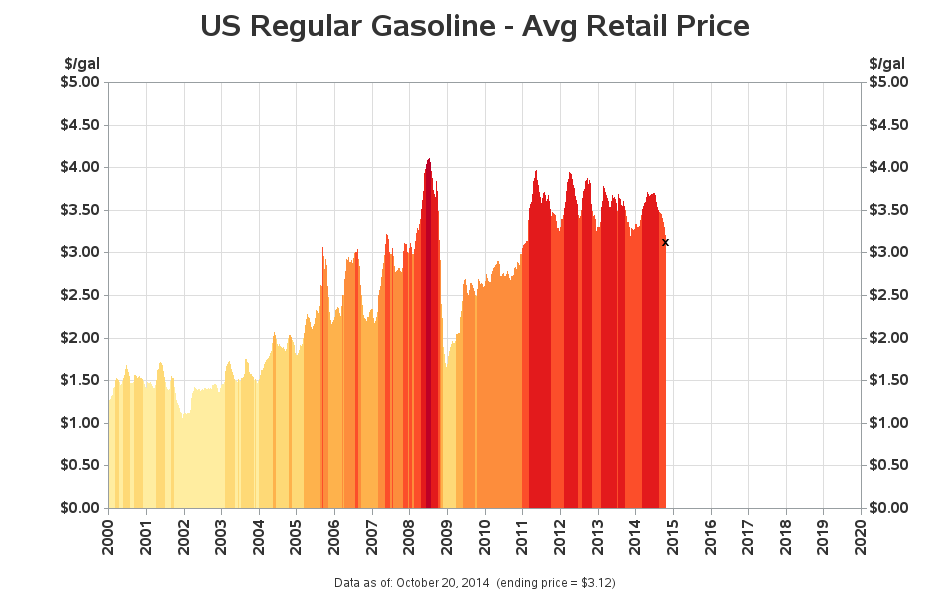
First, let's look at just the price of gasoline over time. Here's a plot of the US average gasoline price, each week since year 2000. I use a very tiny bar (needle) to represent the price of each week, and change to a darker color at each 50-cent price increase. Notice that (in general) the price drops every year in the fall, and stays lower through the winter. Perhaps this is because people travel less, and there is less demand(?) What other factors do you think cause the price drop each fall?
Gasoline if made from oil, and of course the price of gasoline is very related to the price of oil. Saudi Arabia recently hinted that the price of oil might be going down to $80/barrel. I created two graphs where I plot the price of oil and gasoline, so you can visually compare them side-by-side.
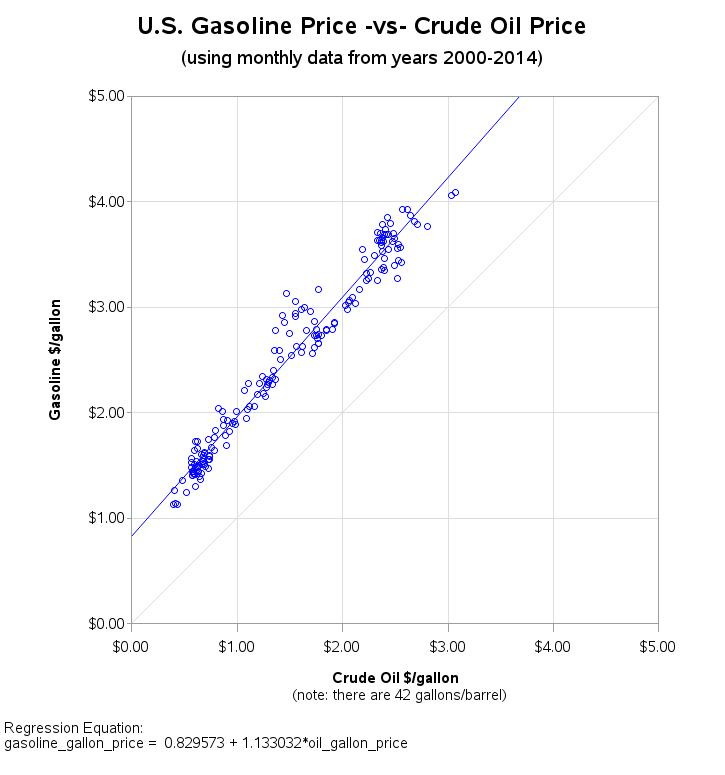
The above two graphs definitely seem to indicate there's a correlation, but I wanted a way to visualize this correlation a bit more directly. Therefore I created a scatter plot with the price of oil on one axis and the price of gasoline on the other, and let SAS calculate a regression line through the data. The data points follow the line fairly closely.
Enough about graphs & analytics ... what's the lowest price you've paid for gasoline this fall? How low do you think the price will go, and how long will the price stay down? (Leave your reply in a comment!)


14 Comments
Another data set that you might use is the gasoline futures price (offset by 1 month of course). This is closer to the price of gasoline before taxes. It might take your offset closer to zero.
Deviation of the slope of the line from unity in your analysis is a convoluted indication of the cost of crude transport, refining, gasoline transport and expected profit margin of the gas station. When you use the futures price, you also remove the latter two from the analysis.
Ahh! - interesting details!
I took $ 80.00 a barrel and divided that by 42 (42 gallons in the barrel; I assumed barrels were 55 gallons for some reason, learned something new). That gave me the price per gallon of crude oil; Rounding the price to $1.905 per gallon of crude. Using the regression formula provided and a quick refresher of
"Please Excuse My Dear Aunt Sally", I came up with the rounded figure of approximately $2.99 per gallon, the estimated low for this year. It seems by looking at data for previous years that you provided, that the price of gasoline per gallon transitions from the years low to the start of the next years climb or rise between December and January, typically starting to slowly climb after the first of January; like clockwork. The transition from the years high to the start of the decline or fall, seems to approximately fall typically between June and July, according to more recent years data compared to earlier. There was somewhat of a slight shift in the peak to fall transition from earlier years. Comments?
And does the mathematical forecast agree with your "gut feeling"? I'm thinking the prices might even go a little lower (maybe down to $2.75) ... perhaps that's wishful thinking though! :-)
One also needs to consider that in North Carolina, $0.56 in taxes is buried into the price of every gallon of gasoline purchased at the pump. It's a fixed rate and not a percentage tax - which might help to explain why the Y-intercept of your graph (if crude oil were to cost $0.00 per gallon) is where it is. Not sure if you used NC prices or average US prices of gasoline, but taxes generally range from $0.30 to $0.70 per gallon between states.
Good point! - Yes, I'm using the average US price.
As said in another comment: the gasoline future price is currently $2.15/gal. For Upstate South Caroline (where I live), that means gas prices in November could be as low as $2.40/gal.
That would be December 2014, of course.
(data: http://money.cnn.com/data/commodities/ look at Unleaded gas)
Chris is correct about the difference in formulation of seasonal gasoline. The traditional reason was modifying the volatility of the fuel. (You want less volatility in summer to minimize evaporation and possible "vapor locking" in carbureted vehicles. You want more volatility in winter so it'll vaporize properly at lower ambient temperatures). Nowadays, there is also the EPA mandates to consider.
Another issue is most gasoline today is 90% gasoline and 10% ethanol (aka E10). The ethanol content slightly reduces the effect of oil prices on gasoline. Also, there's a federal tax credit for refiners to produce E10, which in turn lowers the price for the end consumer. (E10 is cheaper than a comparable-octane E0). Ethanol was seen to some extent in the '70s and early '80s, but was not a factor in the early '90s. So, that'll skew the data a bit.
Ahh! - Thanks for the details, car-guy! :)
Robert
It seems the answer to your question about the seasonal price dip may be even more interesting than first thought - apparently winter gasoline is different to summer gasoline as explained here -> http://auto.howstuffworks.com/fuel-efficiency/fuel-consumption/summer-fuel.htm
Chris
Interesting article!
It would be interesting to color the points on the regression graph differently if they're summer vs. winter months, or run regressions by month, to see how much of an effect the fuel blend has on the price markup.
Good idea!