With Discovery Channel's Shark Week starting on August 10, I decided to sink my teeth into some shark-attack data - I even found there were some shark attacks in the Midwestern US! Read on to learn the details...
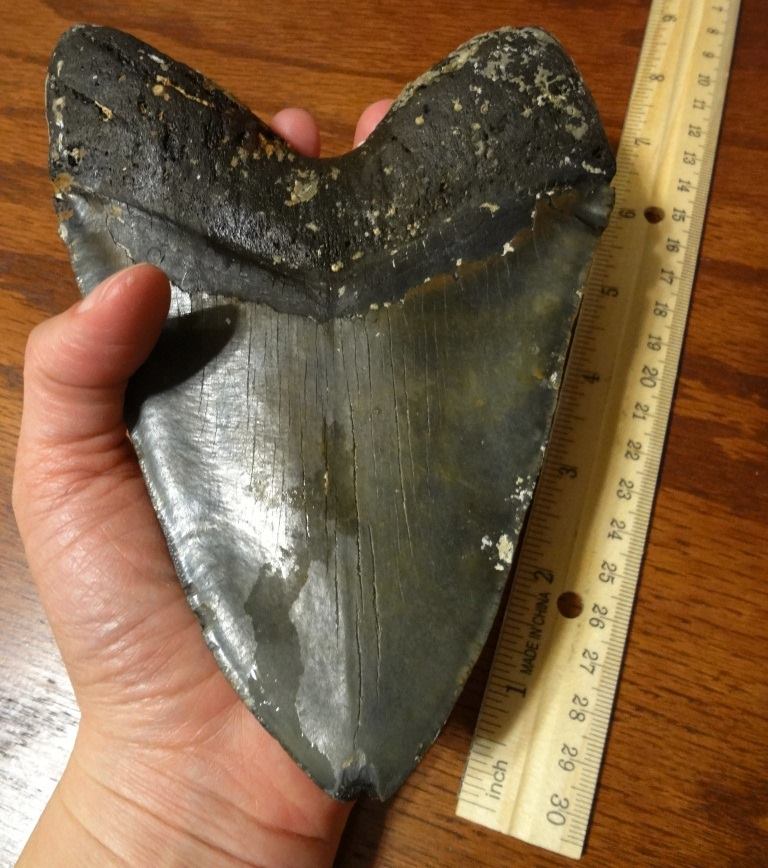
To get you into the shark mindset, here is a photo of an almost 7-inch fossilized tooth from a prehistoric megalodon shark. My friend Rochelle found it while diving off the North Carolina coast. This is about as big as they get, and would have belonged to a shark that was over 50 feet long!
Most people have a morbid curiosity when it comes to sharks attacking humans (especially after the movie Jaws). So I did a bit of searching, and found the sharkattackfile.net website that maintains an impressive list of shark attacks ... but I noticed they didn't have a very good interface to help explore and analyze the data.
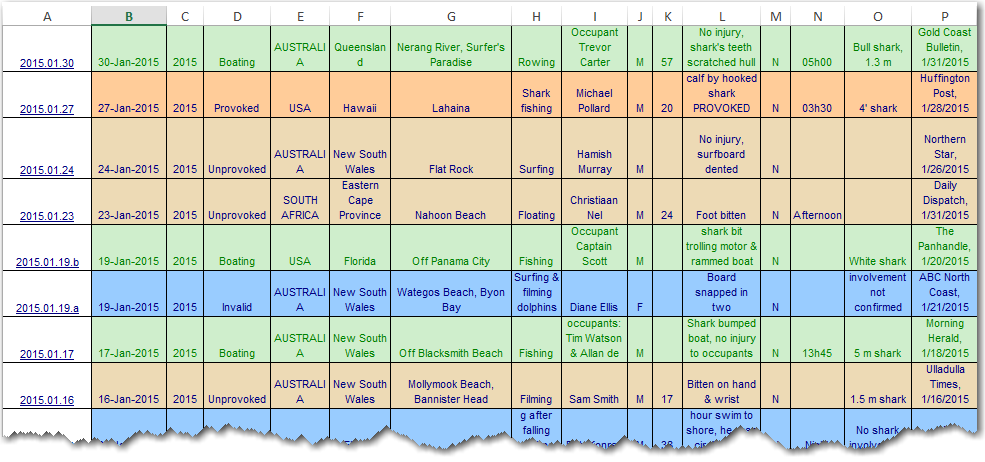
Therefore I downloaded their data, imported it into SAS, and set up a little proof-of-concept showing how SAS can provide a visual interface to help you quickly 'see' more about the data.
Click the map snapshot below to see the full-size interactive version, where the states have hover-text, and drill down to a table listing all the shark attacks in each state. The table then has links to the detailed pages for each individual shark attack.
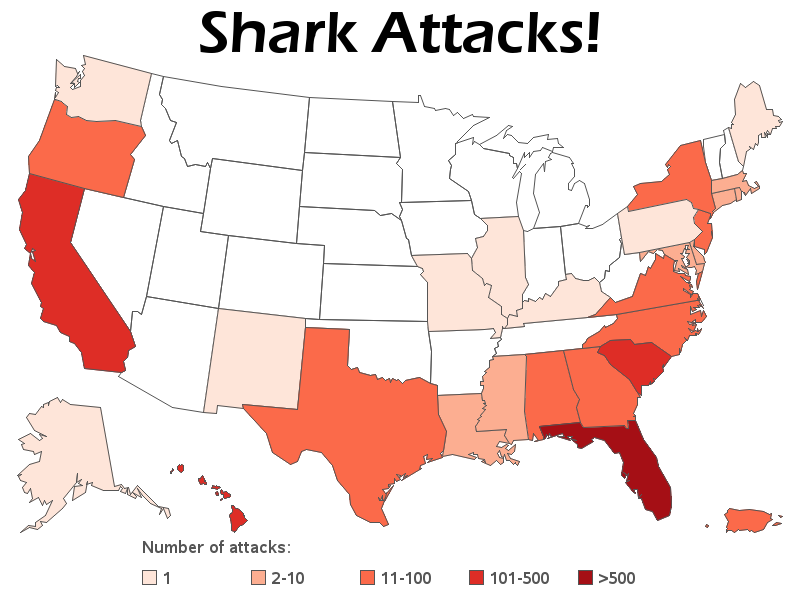
Looking at the data plotted on a map, the first thing that jumps out at me is that several of the inland states in the middle of the US have had shark attacks! How in the world does that happen?!? I clicked those states to see the individual incidents in the table, and then clicked the link in the table to see the details. Sure enough, humans had been 'attacked' by sharks in those states! I'll let you investigate (as I did above) to find out what those details are :)
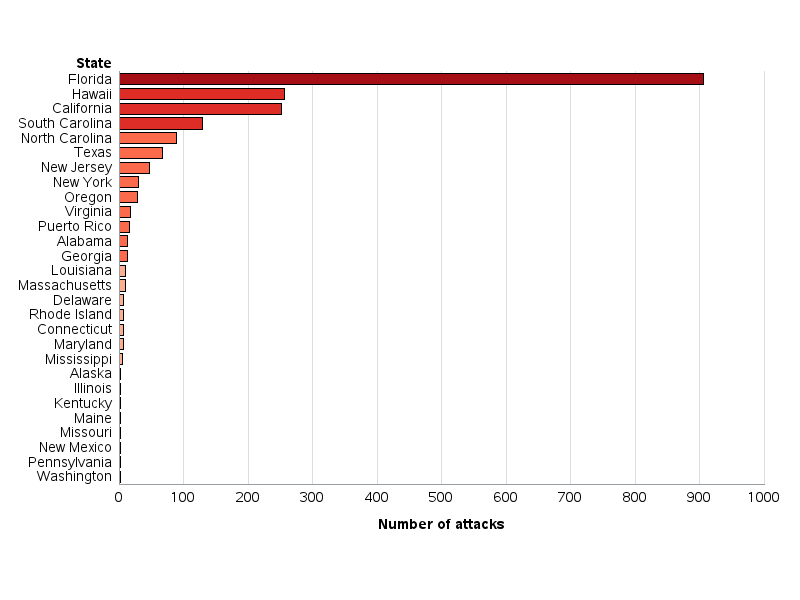
The map is color-coded by gradient shades of (blood) red. You can tell that Florida has the most shark attacks (probably due to having more shoreline and more days warm enough to go to the beach, etc), but it's difficult to tell exactly how the values vary from state to state. Therefore I also created a bar chart of the same data. Looks like North Carolina is in the "top 5" - yikes!
So tell us your "shark story"! Did you see the Jaws movie when it first came out? Have you ever had a close encounter with a shark? Feel free to leave a comment and tell us your shark tale! (... or is that 'shark tail'?) ;-)

6 Comments
Pingback: Using SAS analytics to monitor blog posts | The SAS Training Post
Pingback: Using SAS to get the jump on Shark Week | SAS Training Post
I don't think I would want to be wearing a self-contained underwater breathing apparatus when I found a shark tooth of that magnitude.
But I do have to ask: Missouri, Illinois, and Kentucky all have 1 shark attack. Did that attack happen in the section of the Mississippi river that all 3 states share?
Drill into the details (using the link in the table), and then report back what you find! :)
I took a look at the raw data in SAS Enterprise Guide. I used the Query Builder to create a dummy variable for PROVOKED attacks (and "dummy" is a good term for this, I think).
Of the 5500+ attacks, 507 (or 9.19%) are categorized as "PROVOKED". People: do not poke the shark!
Thanks Chris - this is a very thought-provoking number! :)