In this blog post, I put some classic rock song data under the SAS Analytics microscope, to see if I could get a better picture of exactly what is considered 'classic rock' these days...
Michael Raithel recently pointed me to an interesting article/study about 'classic rock' music, and invited (or is that challenged?) me to see what I could do with this data using SAS graphics. Being a graph guy *and* a DJ, how could I turn down such an opportunity!?!
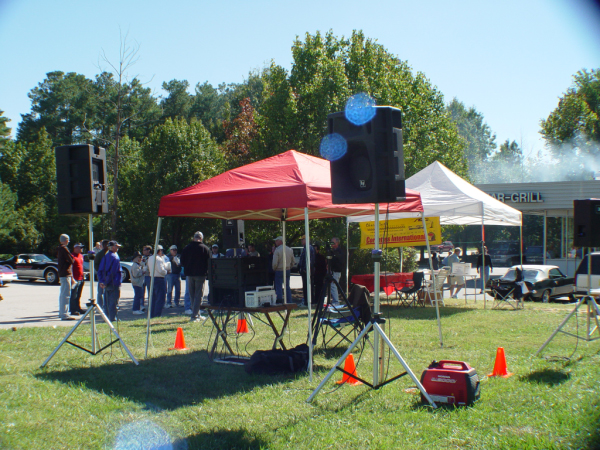
Here's a picture of my DJ setup. I've played quite a bit of classic rock, so hopefully I qualify as a subject matter expert (SME) in this area, LOL!
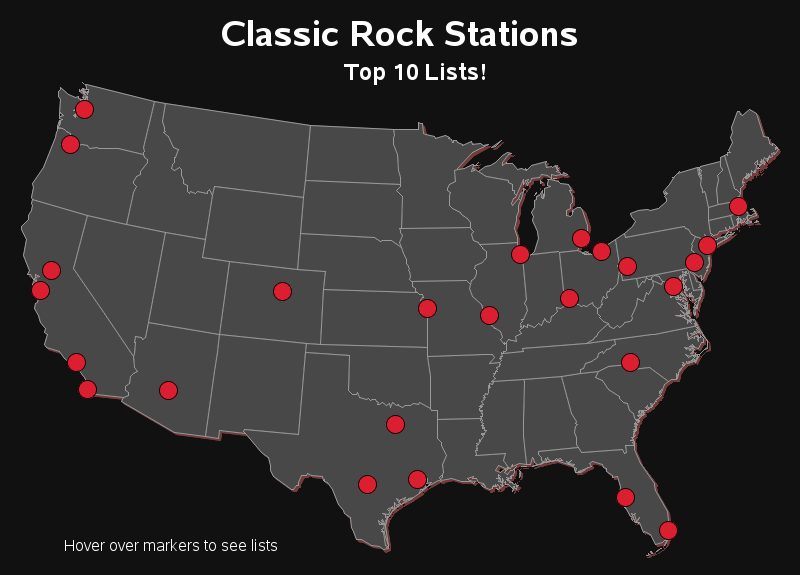
The first question that popped into my head was "where are these 25 radio stations located?" I used Proc Geocode to determine the latitude/longitude centroid of each city, and plotted them on a map. It looks like the stations are pretty well spread out across the US, but not too many from what I consider "the deep south" - therefore the results might not have as much 'southern rock' as I would have liked. While I was creating this map, I decided to add html hover-text, so you can see the "top 10" most frequently played songs for each station (click the snapshot image below to see the interactive map with the hover-text):
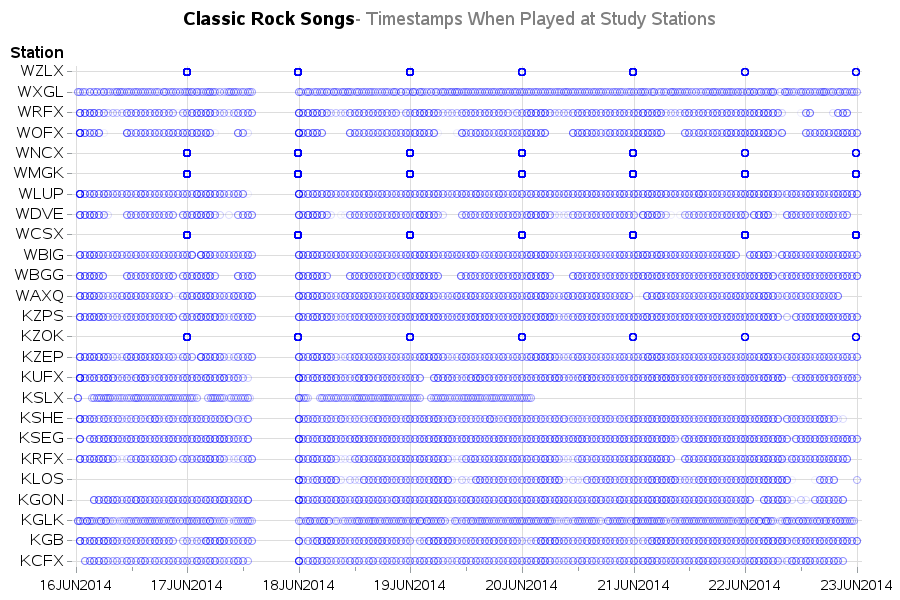
Since the data had a timestamp of when the songs were played, I thought it might be interesting to see if certain songs were played at certain times, etc. But after plotting the data on a timeline, I found that the timestamps were not consistent enough for such a study. Some stations had the song timestamps down to the hour or minute, while others appeared to just have a daily summery (one timestamp per day).
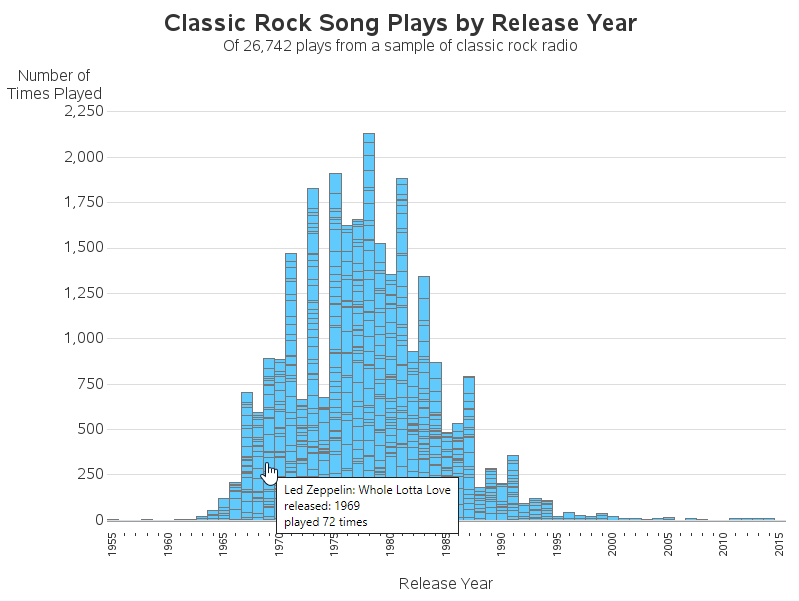
The original article had a nice histogram, showing the distribution of the songs by their release year. I decided to create a similar histogram, but in mine the height of the bars represent the frequency of how many times the songs were played, and I show visible dividers between each song (so you can 'see' which songs were played more than others), and I add html hover text so you can see the names of the songs (click the snapshot image below to see the interactive graph with the hover-text).
And for my final visualization, I decided to come up with a totally different chart (not in the original article). I calculated what were the 20 most-played artists overall, and then created a bar chart showing how often (% of time) each of those artists was played at each of the 25 stations. I wanted to see if a small number of artists was played a 'majority' of the time (which is what it seems like, when I listen to classic rock stations). And, sure enough, one of the stations actually did play the top 20 artists over 50% of the time! Click the snapshot image below to see the interactive graph with the hover-text and drilldown links (be sure to try the drilldowns - on the bar segments, and the bar labels!)
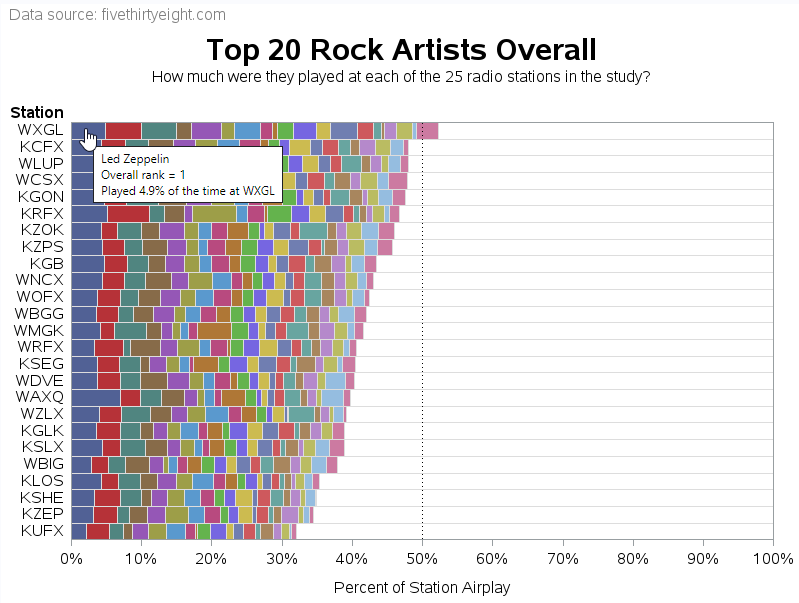
Did you 'discover' anything interesting in these graphs? What's your favorite "classic rock" song?


10 Comments
Pingback: SAS & bugs & rock & roll - SAS Learning Post
Some very interesting graphs there - one point I noticed was the almost complete absence of "home-town" bias in the selections i.e. Hendrix doesn't make the top ten in Seattle despite massive popularity elsewhere, the Beach Boys don't chart in California and ZZ Top are notable by their absence in Texas - although to counteract that Simon and Garfunkel do make the top ten in New York!
Ahh! - Interesting!
Robert,
It's interesting to think that Van Halen is comes in between Led Zeppelin and the Rolling Stones considering these groups are decades apart. I think a slice of time needs to be figured into the analysis, such as when was the cohort in high school. Or maybe a break out by age groups. Having said that a few years back I was with a group of folks having lunch in a Golden Corral and heard Ted Nugent being played over the "Muzak" system, really.
Brian
Yep - it's funny to hear classic rock muzak/instrumental versions of songs in the background. I think there's a whole 'science' around picking what background music will make the target audience buy stuff! :)
I still do a double-take when I hear a Talking Heads song played in a department store. Music that used to be 'alternative' has gone mainstream.
Yep!
Aw Rick, it's the "same as it ever was".
Robert,
That was very generous of you to mention me in your blog; thank you!
I really enjoyed the graphs. Next time I am down your way, I will make it a point to get to a show that you DJ.
Regarding your SAS graphs and analytic prowess: Rock on!
----Michael A. Raithel
It was a great idea Michael - we should team up on interesting data again sometime! :)