The old saying KISS (Keep It Simple) can be applied to just about anything, including sports analytics. Here I use SAS to create some simple charts to analyze a winning soccer team...
To get you into the right mood, here is a picture of my friend Jennifer's dog, who loves soccer :)

In a previous blog post, I showed several fancy graphs you could use for sports analytics. And with the world cup upon us, I thought it would be interesting to re-use some of those graphs to analyze soccer data. But the more I looked at prior World Cup soccer data, the more I noticed that the simple bar charts actually worked best.
Spain was the winner of the 2010 World Cup, so let's see what was so special about Spain in the tournament games.
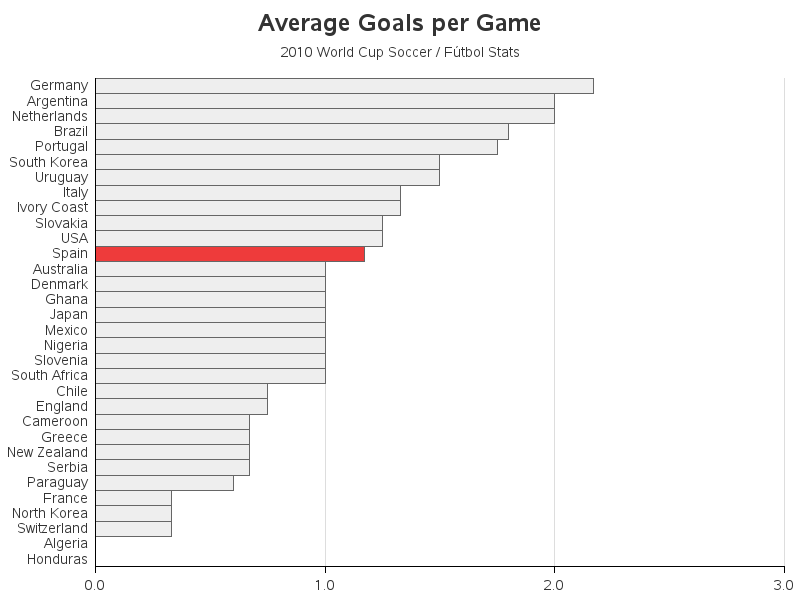
First I assumed that the winning team probably scored the most goals. But they were actually in the middle when it came to goals per game:
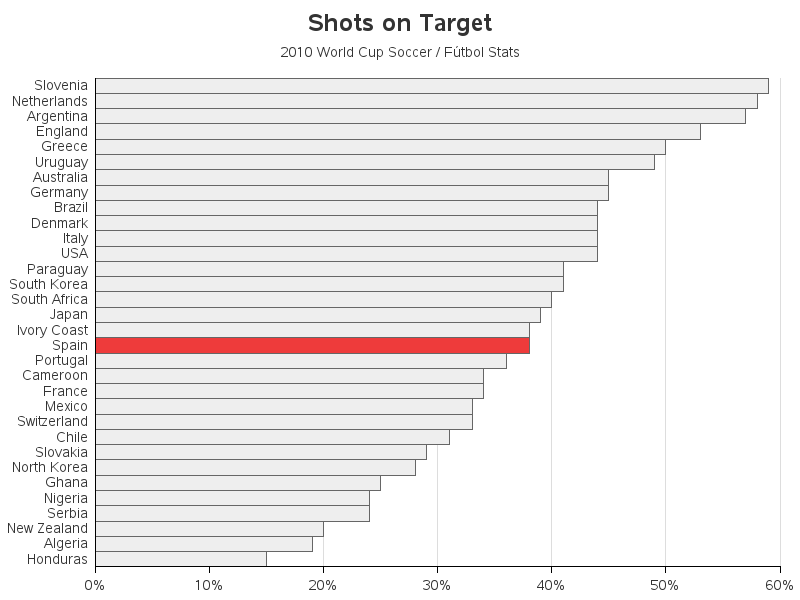
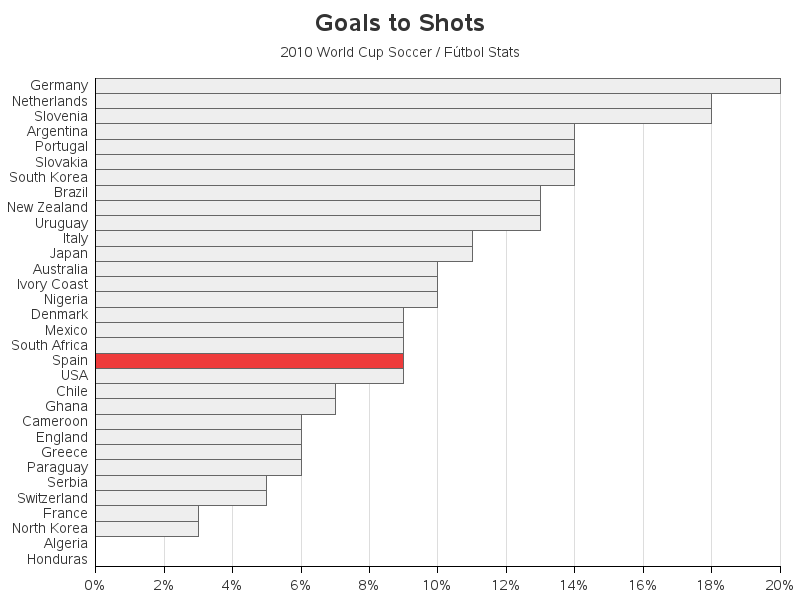
How about the % of shots on target, or the % of their shots that made goals? Nope! They were also right in the middle in those areas too!
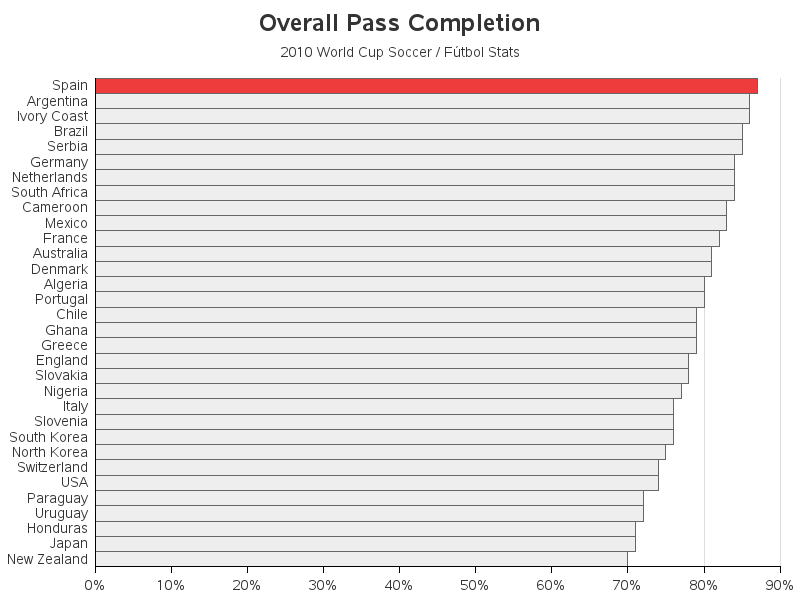
So, where did Spain "stand out" in the graphs? They were #1 in Overall Pass Completion:
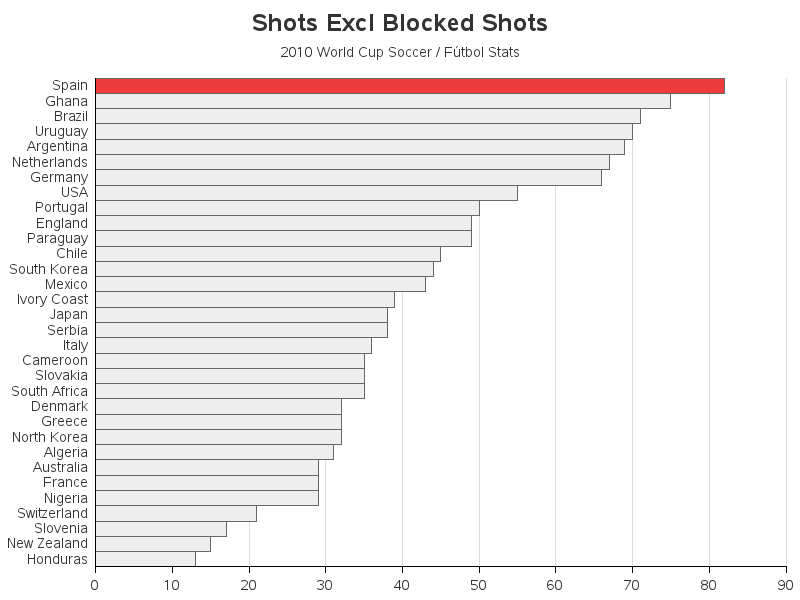
They were #1 in Shots Excl Blocked Shots:
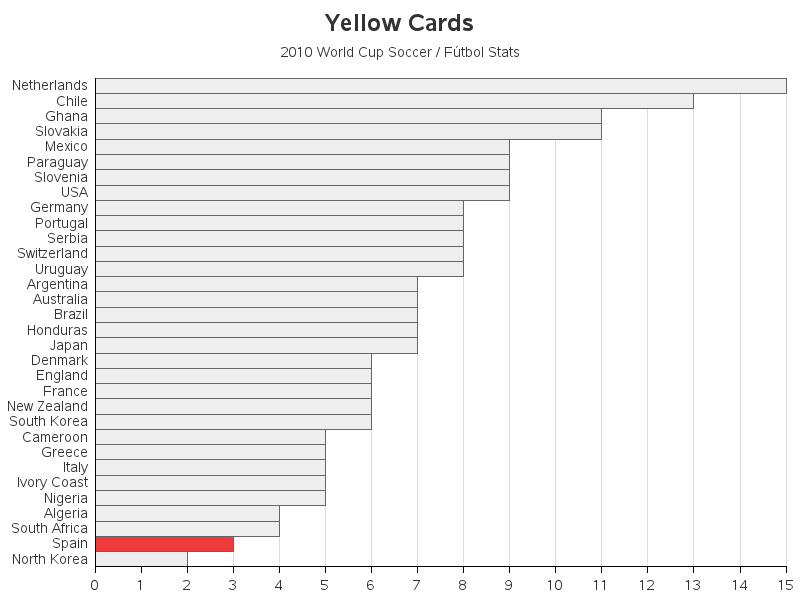
They were #2 for having the least number of Yellow Cards:
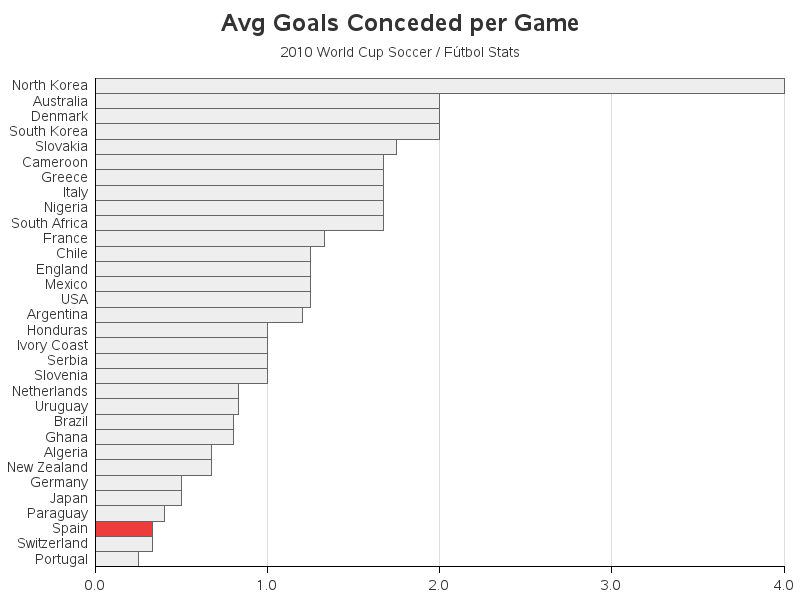
And they were #3 in having the lowest Average Goals Conceded per Game:
Ok you soccer players & fans - were there any surprises here?!? Can any of you SMEs (subject matter experts) help further explain the data - are these factors important, or just a coincidence? What's your theory on what it takes for a team to win the World Cup, and do you have any data & analytics to help support your theory? :)

10 Comments
Where is Costa Rica?
I don't believe Costa Rica was in the 2010 World Cup(?)
An interesting piece of analysis - two points though:
1. Defence is as important as attack - Spain kept more "clean sheets" than any other team (5), particularly important when you realise they didn't concede a single goal during the knockout phase.
2. Not all goals are equal e.g. during the whole tournament Spain only scored one goal more than Portugal but all of Portugal's goals came in their 7-0 thumping of North Korea; also Ivory Coast had more goals per game than Spain but were eliminated in the group stage, so context is vital!
Sounds like good points!
Luck=(Ronaldo scoring against US in last seconds to tie, risking US advancement) & (Ronaldo scoring against Ghana in final minutes to give Portugal the lead, causing US advancement despite US loss to Germany)
Is that a better example of luck, or irony?!? :)
Interesting charts, but what do we see if we look at the second best team (Netherlands)?
They were far better in Goals to Shots or Shots on Target. Moreover, they were number one in Yellow Cards!
Maybe we need a bar chart for LUCK as well.
LOL @ "bar chart for LUCK"! ;)
:)
I'm thinking if we can quantify LUCK in soccer: what is it? When the ball hits the post? An own goal?
And after we find a way to quantify LUCK ... then we have to find a way to predict/forecast it!